
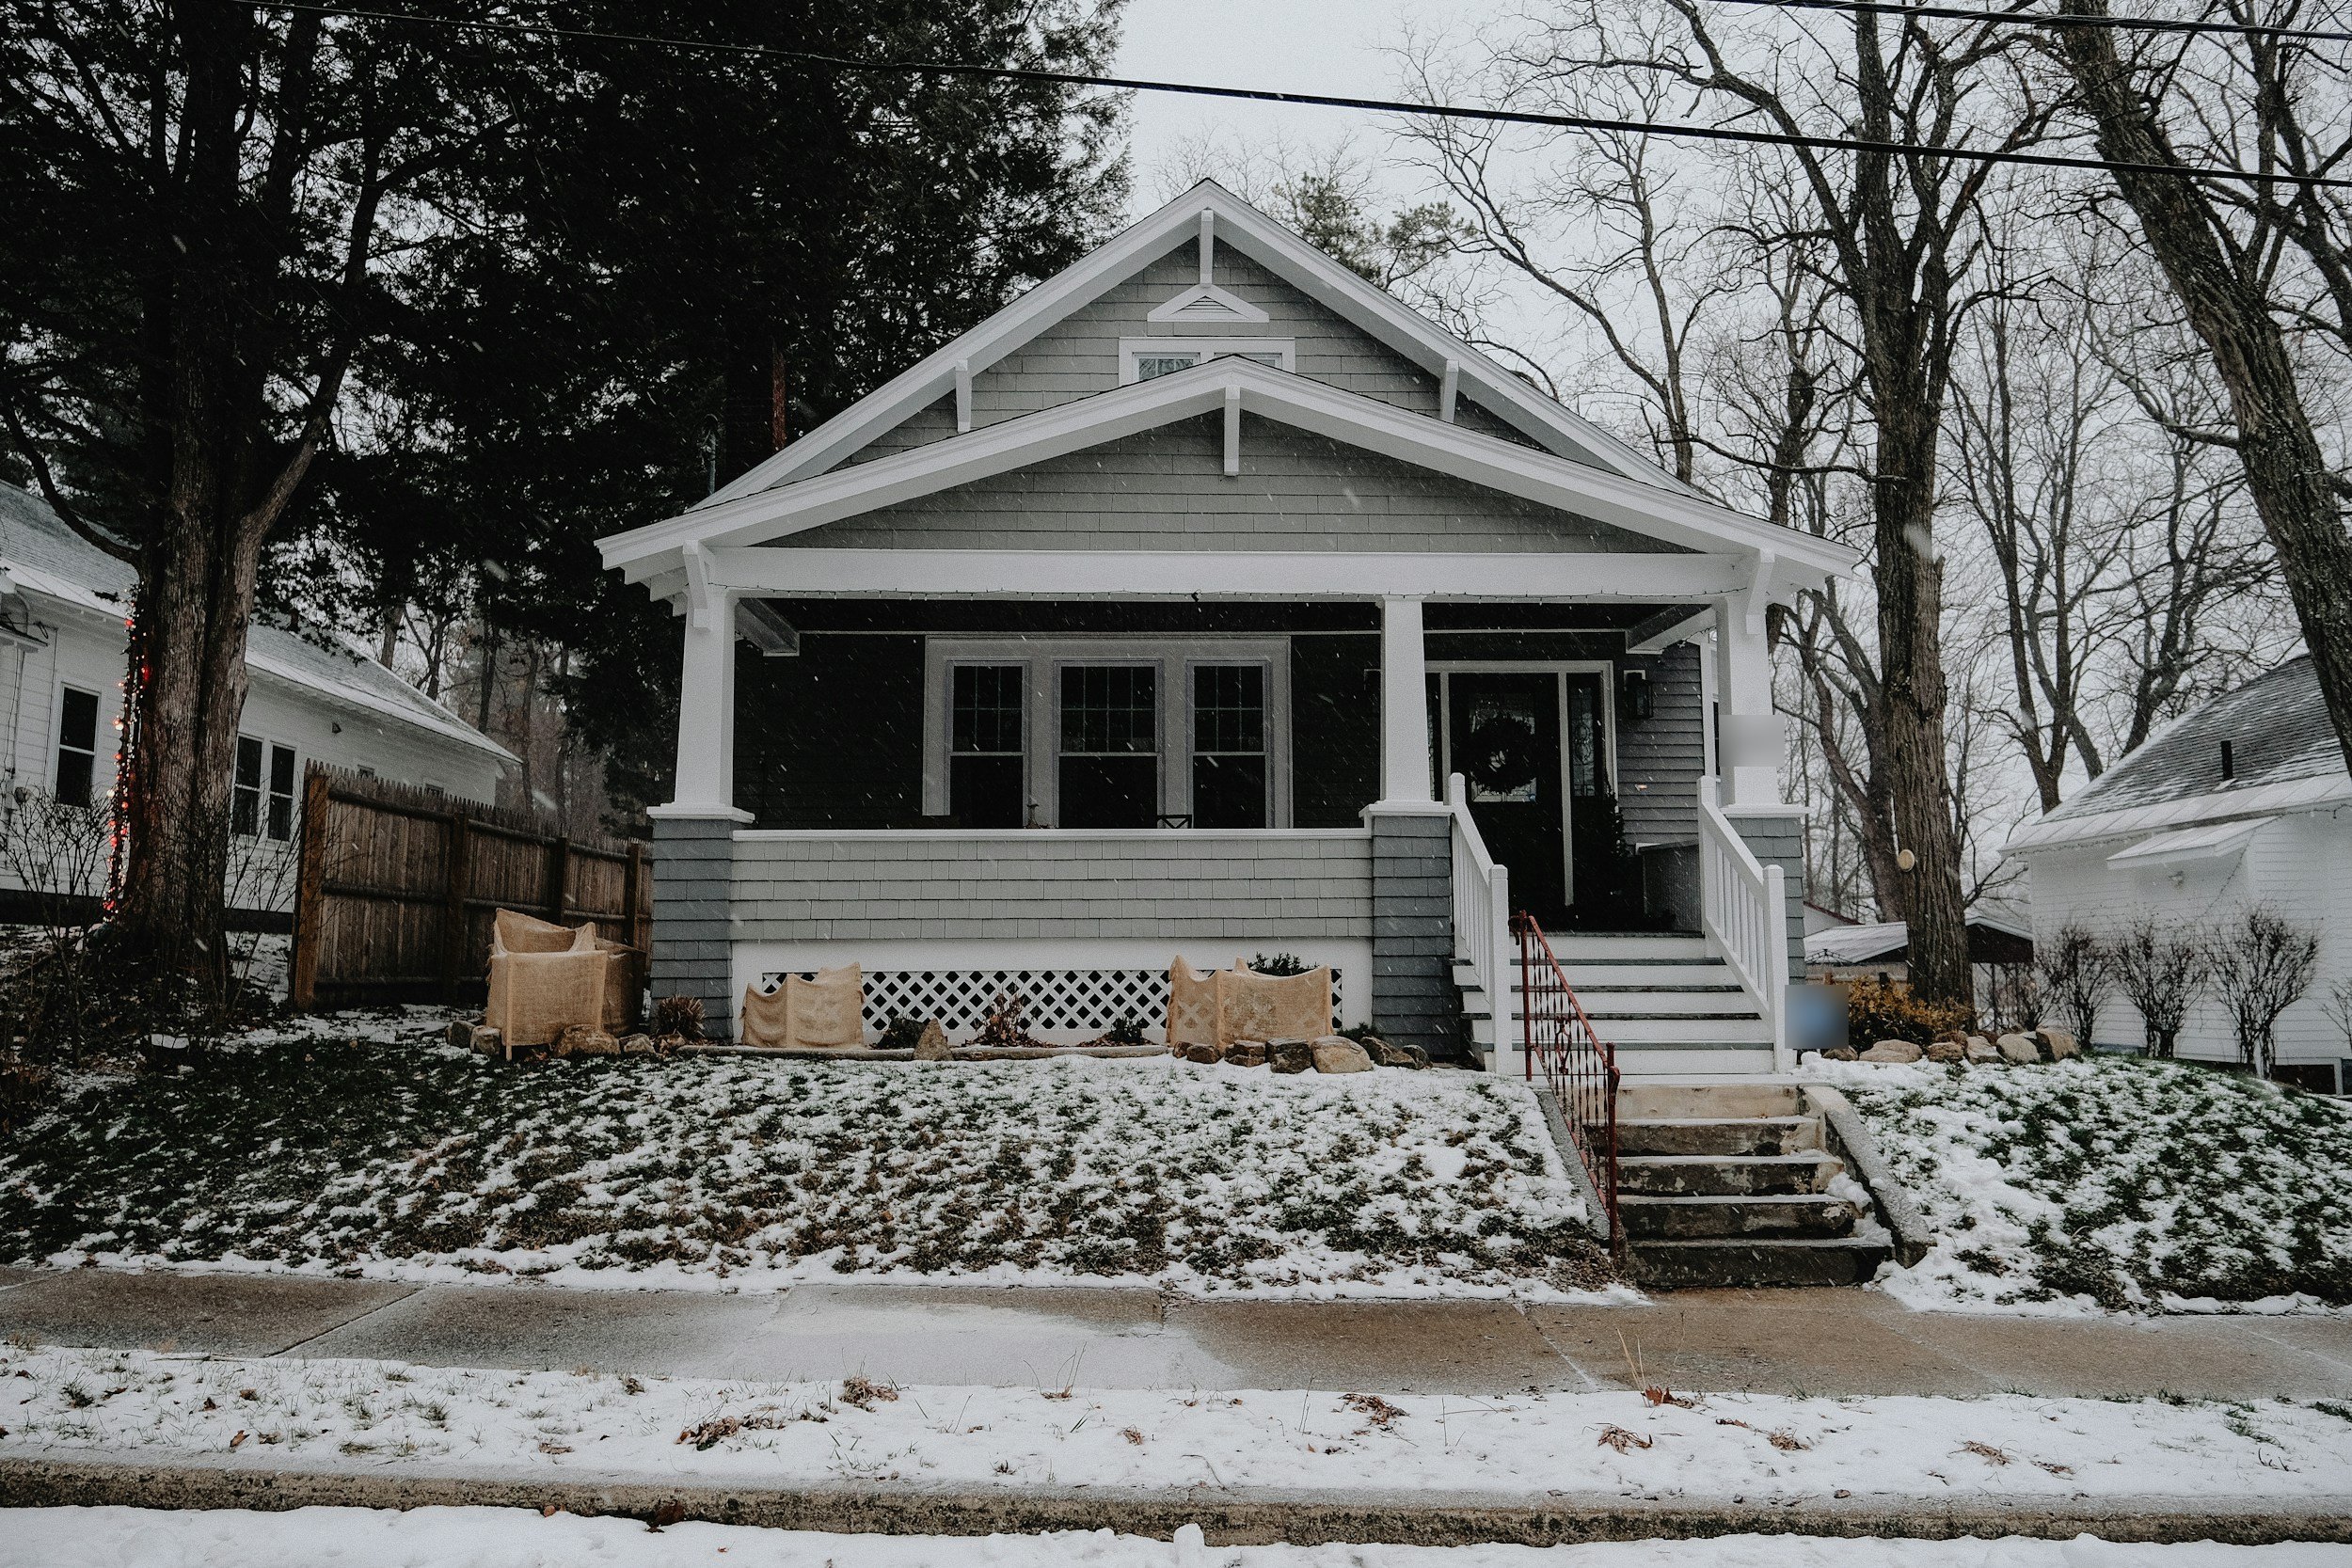
Short answer: Spring starts early.
Real answer: February is when Seattle real estate turns. The average Seattle house sells at 104.1% of list, up from 100.5% in January, and 9 days faster. New listings rise only a little, so buyers compete for a short supply. February 2026 was softer than normal in every segment. Fall 2026 is softer still: October 2026 had 52% more Seattle houses for sale than a normal October.
I pull these numbers from NWMLS every month for my market page. The month-by-month averages for every month live in the 10-year market trends post, and the month before this one is January.
Same thing, other names: the February housing market, the February real estate market, the late-winter market or the early spring market.
February market check
February in Seattle and the Eastside: normal vs. last year vs. now
Pick an area, a home type and your side. You get a normal February from 10 years of NWMLS data, February 2026, and the newest month.
| Measure | Normal February | February 2026 | vs. normal | February rank |
|---|
Heading into February 2027
Source: NWMLS via InfoSparks, November 2016 to October 2026. Normal = the 10-year average for the month (closed-sale weighted for price and days). Seattle = the city; Eastside = Bellevue, Kirkland, Redmond, Mercer Island, Sammamish, Issaquah, Newcastle and Woodinville. Sale price is % of the final list price. Loan applications: MBA Weekly Applications Survey, not seasonally adjusted, 2016 to 2025. Not a forecast. Neighborhoods and homes vary.
10-year average
What a normal February looks like in Seattle
Prices jump back above list
Seattle houses sell at 104.1% of their final list price in a normal February. January is 100.5%. That 3.6-point jump is the biggest month-to-month change of the year. April peaks at 105.8%.
Homes sell 9 days faster than January
The average Seattle house takes 28 days to sell in February, against 37 days in January. Eastside houses take 32 days. By April, Seattle is down to 14 days.
Listings rise, but slowly
About 461 Seattle houses list in a normal February, up from 383 in January. That is still the 4th fewest of 12. March brings 684. Only about 329 close, 2nd fewest of 12, because most of them went under contract in January.
Seattle houses by month, 10-year average
Sale price, % of list
Days on market
Last year
February 2026 vs. a normal February
February 2026 was softer than a normal February in every segment. More homes sat on the market, they sold further under list, and they took longer.
| Normal February / February 2026 | Homes for sale | Months of supply | Sale price, % of list | Days on market |
|---|---|---|---|---|
| Seattle houses | 428 / 763 | 1.3 mo / 2.3 mo | 104.1% / 101.4% | 28 / 29 |
| Seattle townhomes | 243 / 571 | 1.4 mo / 3.9 mo | 101.1% / 99.4% | 33 / 47 |
| Seattle condos | 424 / 856 | 2.4 mo / 5.3 mo | 100.6% / 98.3% | 44 / 64 |
| Eastside houses | 396 / 685 | 1.6 mo / 3.1 mo | 104.5% / 99.2% | 32 / 41 |
| Eastside townhomes | 82 / 252 | 1.6 mo / 4.3 mo | 102.8% / 98.9% | 29 / 55 |
| Eastside condos | 164 / 403 | 1.6 mo / 6.4 mo | 101.3% / 98.8% | 37 / 49 |
Seattle houses had 763 for sale, against 428 in a normal February. There were 26% more new listings than normal. They sold at 101.4% of list in 29 days. Townhomes and condos had about 2.2 to 4.1 times the normal months of supply.
Homes for sale in February: normal vs. February 2026
428 → 763
243 → 571
424 → 856
396 → 685
82 → 252
164 → 403
Normal FebruaryFebruary 2026
What was in the news in February 2026
Rates under 6%. The 30-year fixed averaged 5.98% the week of February 26, 2026. It was the first time under 6% in three and a half years (Freddie Mac).
More homes, fewer sales. King County had 4,399 homes and condos for sale at the end of February, up 35.5% from a year earlier. Closed sales fell 10% to 1,364. The median sale price was $840,000, up 9.1% from January (NWMLS).
A Super Bowl parade. The Seahawks won Super Bowl LX on February 8. The city expected 750,000 to 1 million fans downtown for the parade on February 11 (City of Seattle).
What I saw in February 2026
Late in the month, a well-kept house in northwest Seattle drew 16 offers. The winning offer waived every contingency. The winter sales nearby pointed lower, which is how comps read in February: they lag the market by a season.
Right now
Where the market stands now: fall 2026
The newest numbers are softer than February 2026. In October 2026 the NWMLS area had 23,519 homes for sale, up 25.2% from a year earlier, and 4.41 months of inventory (NWMLS). Pending sales fell 17.8%.
In King County the single-family median was $925,000, down 7.2% from October 2025. Condos fell harder: the median was $465,000, down 15.5%, with 7.0 months of inventory.
Rates moved the other way from February 2026. The 30-year fixed averaged 7.11% the week of November 12, 2026, against 5.98% at the end of February 2026 (Freddie Mac). The tool above shows how far each segment sat from normal in October 2026.
The season
February weather, daylight and Presidents’ Day in Seattle
Drier, but the snowiest month
Sea-Tac averages 3.76 inches of rain in February, about 2 inches less than January. It is also the snowiest month, with 2.2 inches on average and about 6 nights at or below freezing (NOAA).
The light comes back
Daylight grows from 9 h 34 m on February 1 to 11 h 0 m by February 28. Sunset moves from 5:10 p.m. to 5:52 p.m., so after-work showings get daylight again (NOAA solar equations).
Presidents’ Day
Presidents’ Day, the third Monday of February, is a legal holiday in Washington (RCW 1.16.050). In 2027 it falls on Monday, February 15. Banks, county offices and many lenders close, so plan around a 3-day weekend.
Rain and snow by month at Sea-Tac, inches (1991 to 2020 normals)
Rain
Snow
February 19 h 34 m of daylight
February 2811 h 0 m
June 2115 h 59 m
What comes next
Why March brings the listings
Buyers lead in February, and sellers follow in March. U.S. purchase loan applications run at 101 in February on a scale where 100 is an average month. They reach 116 in March and 118 in April.
In a normal March, 684 Seattle houses list, 48% more than February. In my experience, March starts the high run of new listings that lasts until October.
Prices and pace keep climbing. A normal March sells at 105.5% of list in 20 days.
U.S. home purchase loan applications by month (100 = an average month)
Your side
What February means if you are selling, buying or owning
Selling
Buyers are back and most sellers are not yet, so competing listings stay low. Homes sell faster and closer to list than in any winter month. When to list is a strategy call, and it lives in my seller’s guide, month by month. For the season-by-season background, see when is the best time to sell.
Buying
You face more competition than in January, with only a little more choice. Homes sell above list on average and faster each week. How I use these weeks for clients is in my buyer’s guide, month by month.
Owning
February sale prices jump in a normal year, so compare with a normal February, not with January. Online estimates lean on winter sales and can trail for a few weeks. Your February jobs, from snow to gutters, are in the February home maintenance checklist.
- Early FebruaryBuyers backPreapproved buyers from January start writing offers.
- Mid-FebruaryPresidents’ DayA 3-day weekend: banks, county offices and many lenders close.
- MarchListings surge684 new Seattle houses in a normal March, 48% more than February.
- April to MayPeakHighest prices (April) and the most listings (May).
Frequently asked questions about the February housing market
Is February a good time to sell a house in Seattle?
Buyers are back and competing listings are still low. The average Seattle house sells at 104.1% of list in 28 days. The timing call is strategy, covered in my seller’s guide.
Is February a good time to buy a house in Seattle?
Competition is up and choice is still thin: about 461 new Seattle houses list in a normal February, against 861 in May. Rates and your own timing matter more than the month.
What is the hardest month to sell a house in Seattle?
December has the fewest new listings and the lowest sale price against list (100.2%). January has the fewest closings and the longest days on market (37 days).
What month do houses sell for the least in Seattle?
Against list price, December: 100.2% for the average Seattle house. February is 104.1%, and April peaks at 105.8%.
Which month is the best to sell a house in Seattle?
By the averages, April: the highest sale price against list (105.8%) and 14 days on market. Every month has trade-offs, covered in when is the best time to sell.
Do home prices go up in February?
Sale price against list jumps from 100.5% in January to 104.1% in February, the biggest monthly change of the year. That is a seasonal pattern, not a forecast.
Is it better to buy a house in February or in March?
March has more homes: 684 new Seattle house listings in a normal March, against 461 in February. It also has higher sale prices against list (105.5%).
Should I relist my house in February?
A normal February has more buyers and higher sale prices against list than December or January. Whether that fits your home is a strategy call, covered in my seller’s guide.
Will mortgage rates drop in February?
No one can say. Rates dipped under 6% in late February 2026, then rose to 7.11% by November 12, 2026 (Freddie Mac). Check the current week before you plan around a rate.
The bottom line
February is when spring starts: sale prices jump back above list, homes sell 9 days faster than January, and listings lag a month behind buyers. February 2026 was softer than normal, and fall 2026 is softer still, with more homes for sale and rates near 7%. Read every February number against a normal February, and expect March to bring the listings.
Sources
- NWMLS via InfoSparks (member data), Seattle and 8 Eastside cities, houses, townhomes and condos, November 2016 to October 2026; 10-year averages by Brian Huie, Compass.
- NWMLS, Monthly Market Snapshot, October 2026
- Freddie Mac, Primary Mortgage Market Survey, November 12, 2026
- Freddie Mac, Mortgage Rates Drop Below 6% for the First Time in 3.5 Years, February 26, 2026
- NWMLS February 2026 Market Report, King and Kittitas counties, March 6, 2026
- City of Seattle, Seahawks World Champions Parade, February 9, 2026
- Mortgage Bankers Association, Weekly Applications Survey, Purchase Index (not seasonally adjusted), 2016 to 2025, averaged by month by Brian Huie
- NOAA NCEI, U.S. Climate Normals 1991 to 2020, Seattle-Tacoma International Airport
- NOAA Global Monitoring Laboratory, Solar Calculator (Seattle sunrise and sunset, February 2027)
- Washington State Legislature, RCW 1.16.050, Legal holidays
- brianhuie.com/market, Seattle and Eastside market update
- Be Home in Seattle, Seattle and Eastside housing market by month: 10-year trends