
The Blog

Seattle Housing Market in October 2026: How It Compared to a Normal October
October brings fewer new listings in Seattle: about 621 houses list, 25% fewer than September, while closings rise 14%. Here is October 2026 against a normal October, and where the market stands now.

What Is NWMLS First Look, and How Does It Work in Seattle?
NWMLS First Look gives Seattle sellers up to 21 days before going Active. Plan your dates in the First Look planner and see exactly what buyers and brokers see.

Seattle Housing Market in September 2026: How It Compared to a Normal September
September brings a second wave of listings in Seattle: about 825 houses list, 32% more than August, and homes for sale peak. Here is September 2026 against a normal September, and where the market stands now.
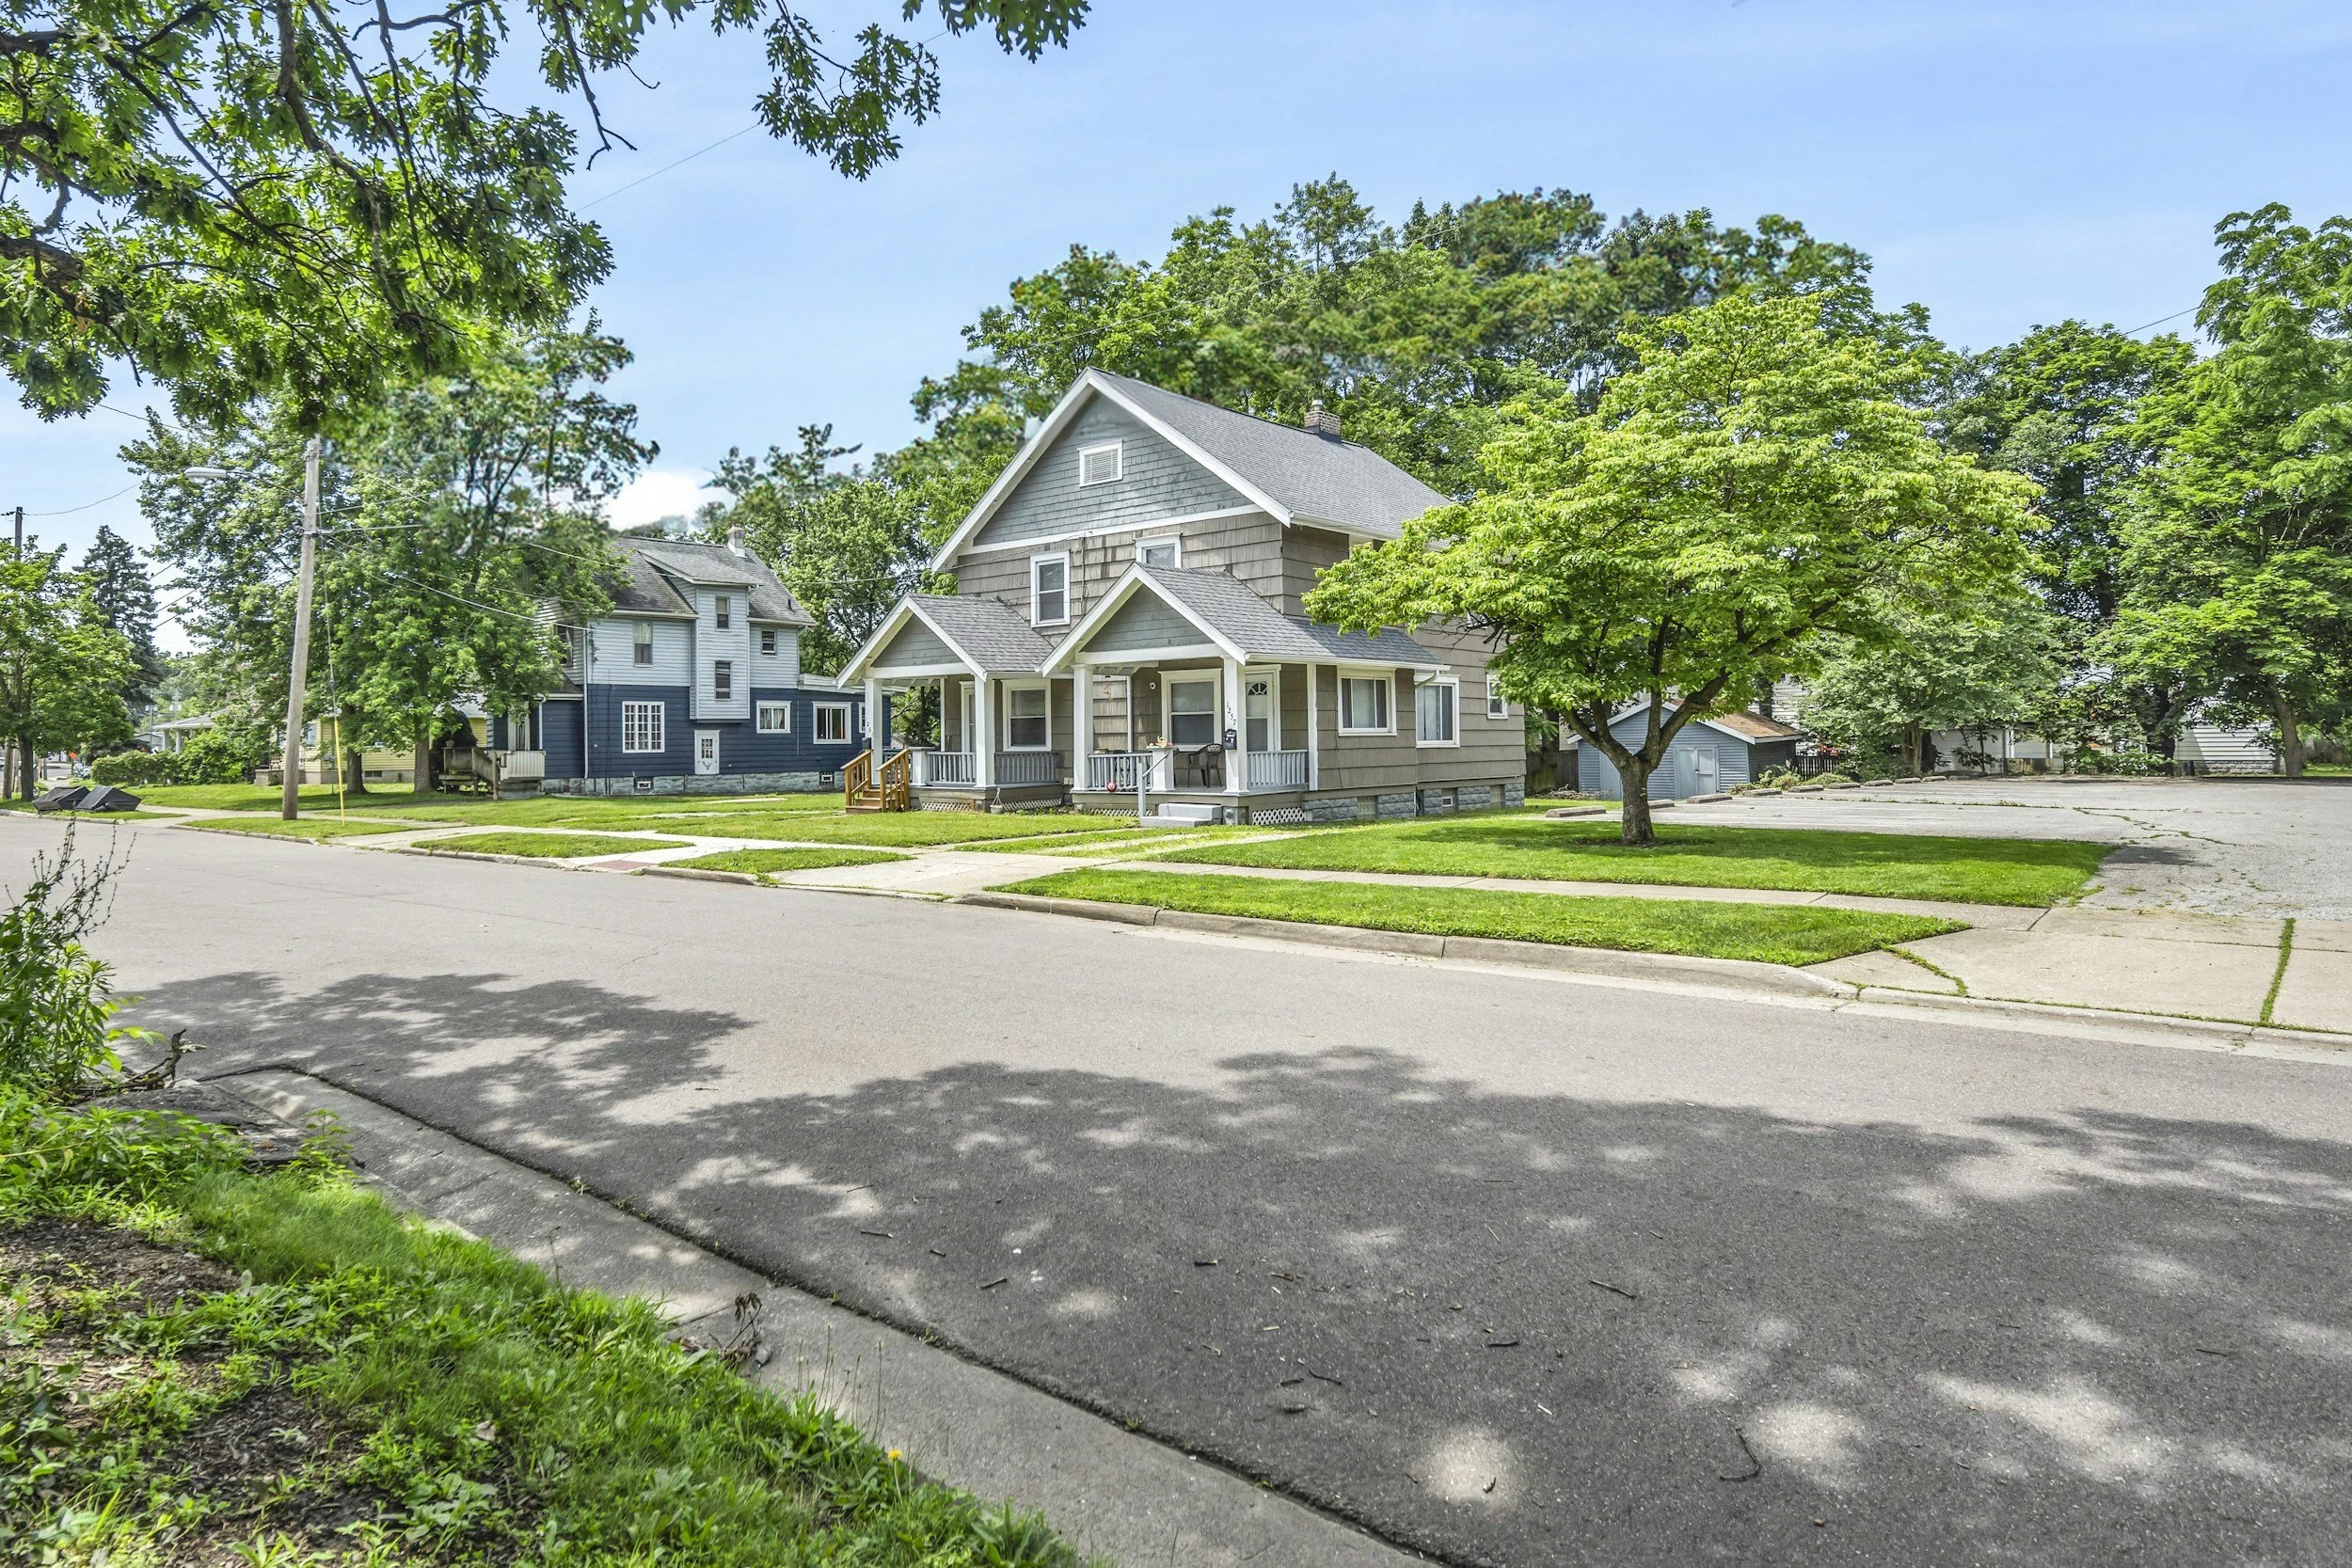
Seattle Housing Market in August 2026: How It Compared to a Normal August
August is the quiet month for new listings in Seattle, about 623 houses, 14% fewer than July, while closings stay busy. Here is August 2026 against a normal August, and where the market stands now.
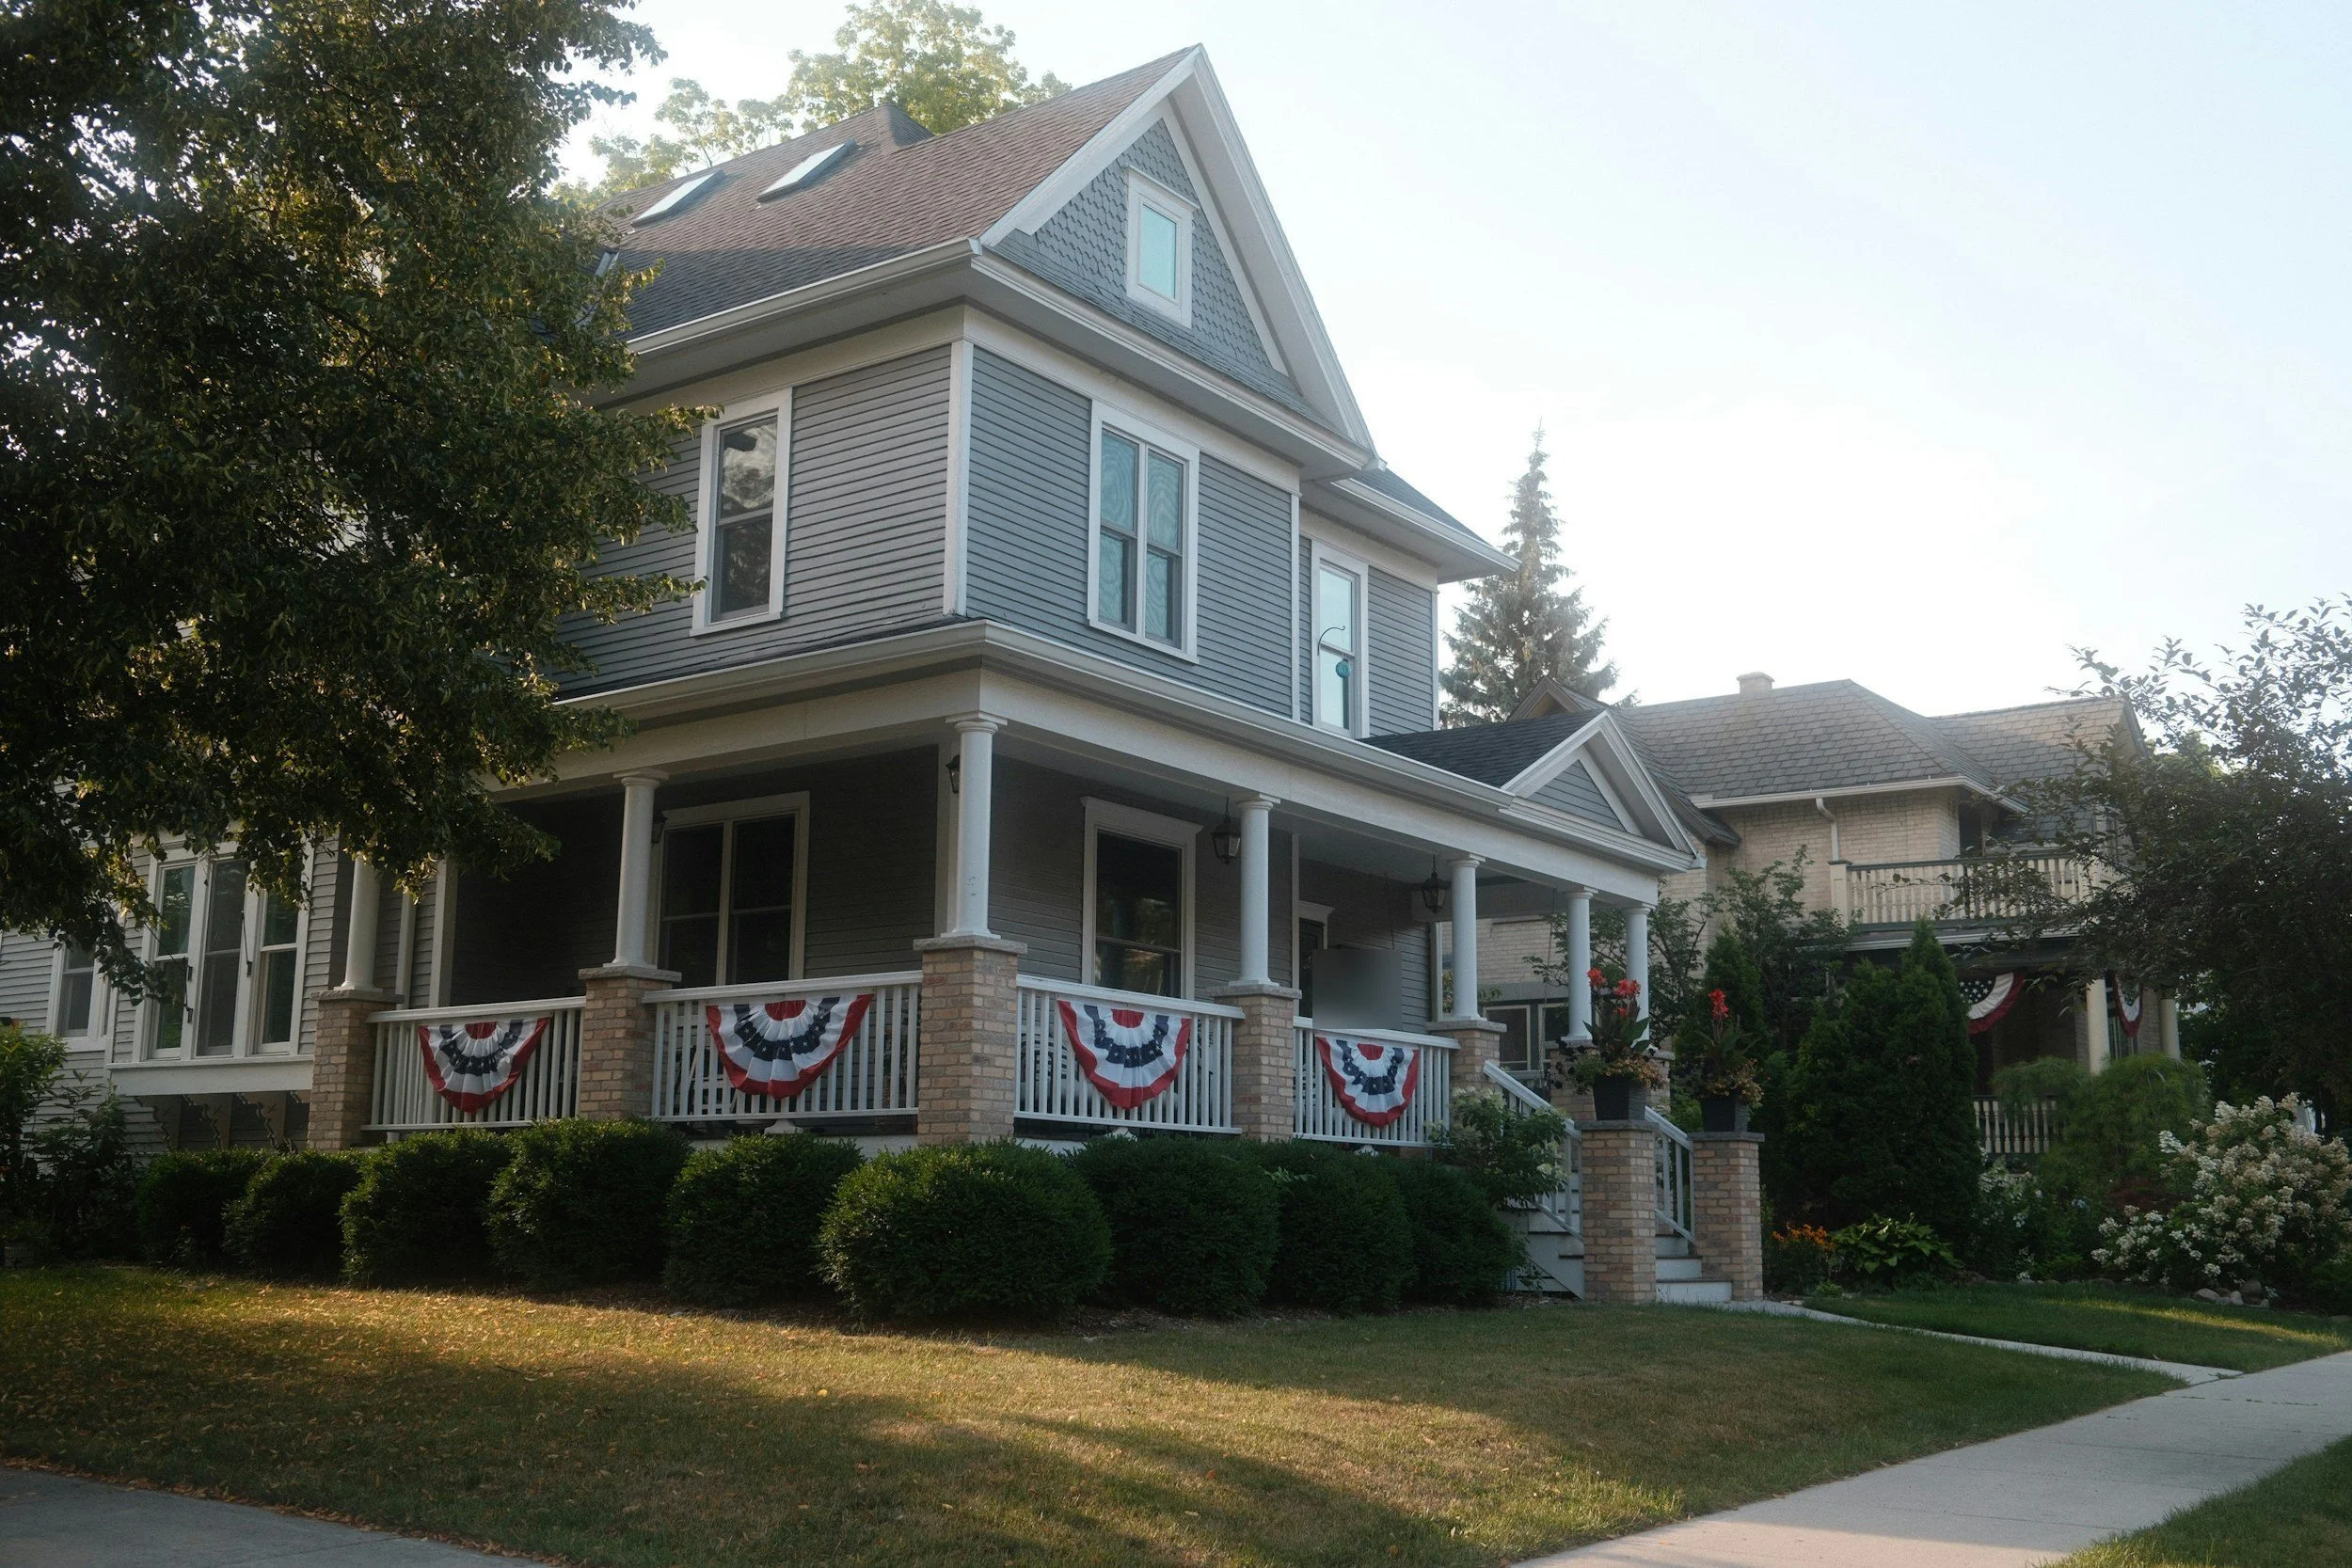
Seattle Housing Market in July 2026: How It Compared to a Normal July
July brings the 2nd most closings of the Seattle year, about 590 houses, as June contracts finish, while new listings fall 14%. Here is July 2026 against a normal July, and where the market stands now.

Seattle Housing Market in June 2026: How It Compared to a Normal June
June brings the most closings of the Seattle year, about 623 houses, and homes sell in 14 days, tied with April for the fastest. Here is June 2026 against a normal June, and where the market stands now.

Seattle Housing Market in May 2026: How It Compared to a Normal May
May brings the most new listings of the Seattle year, about 861 houses, and prices stay close to the April peak at 105.2% of list. Here is May 2026 against a normal May, and where the market stands now.

Seattle Housing Market in April 2026: How It Compared to a Normal April
April is the peak of the Seattle year: homes sell at 105.8% of list in 14 days, the highest price and fastest pace of any month. Here is April 2026 against a normal April, and where the market stands now.
Seattle Housing Market in March 2026: How It Compared to a Normal March
March is when Seattle sellers come back: new house listings jump 48% from February, and homes sell at 105.5% of list. Here is March 2026 against a normal March, and where the market stands now.
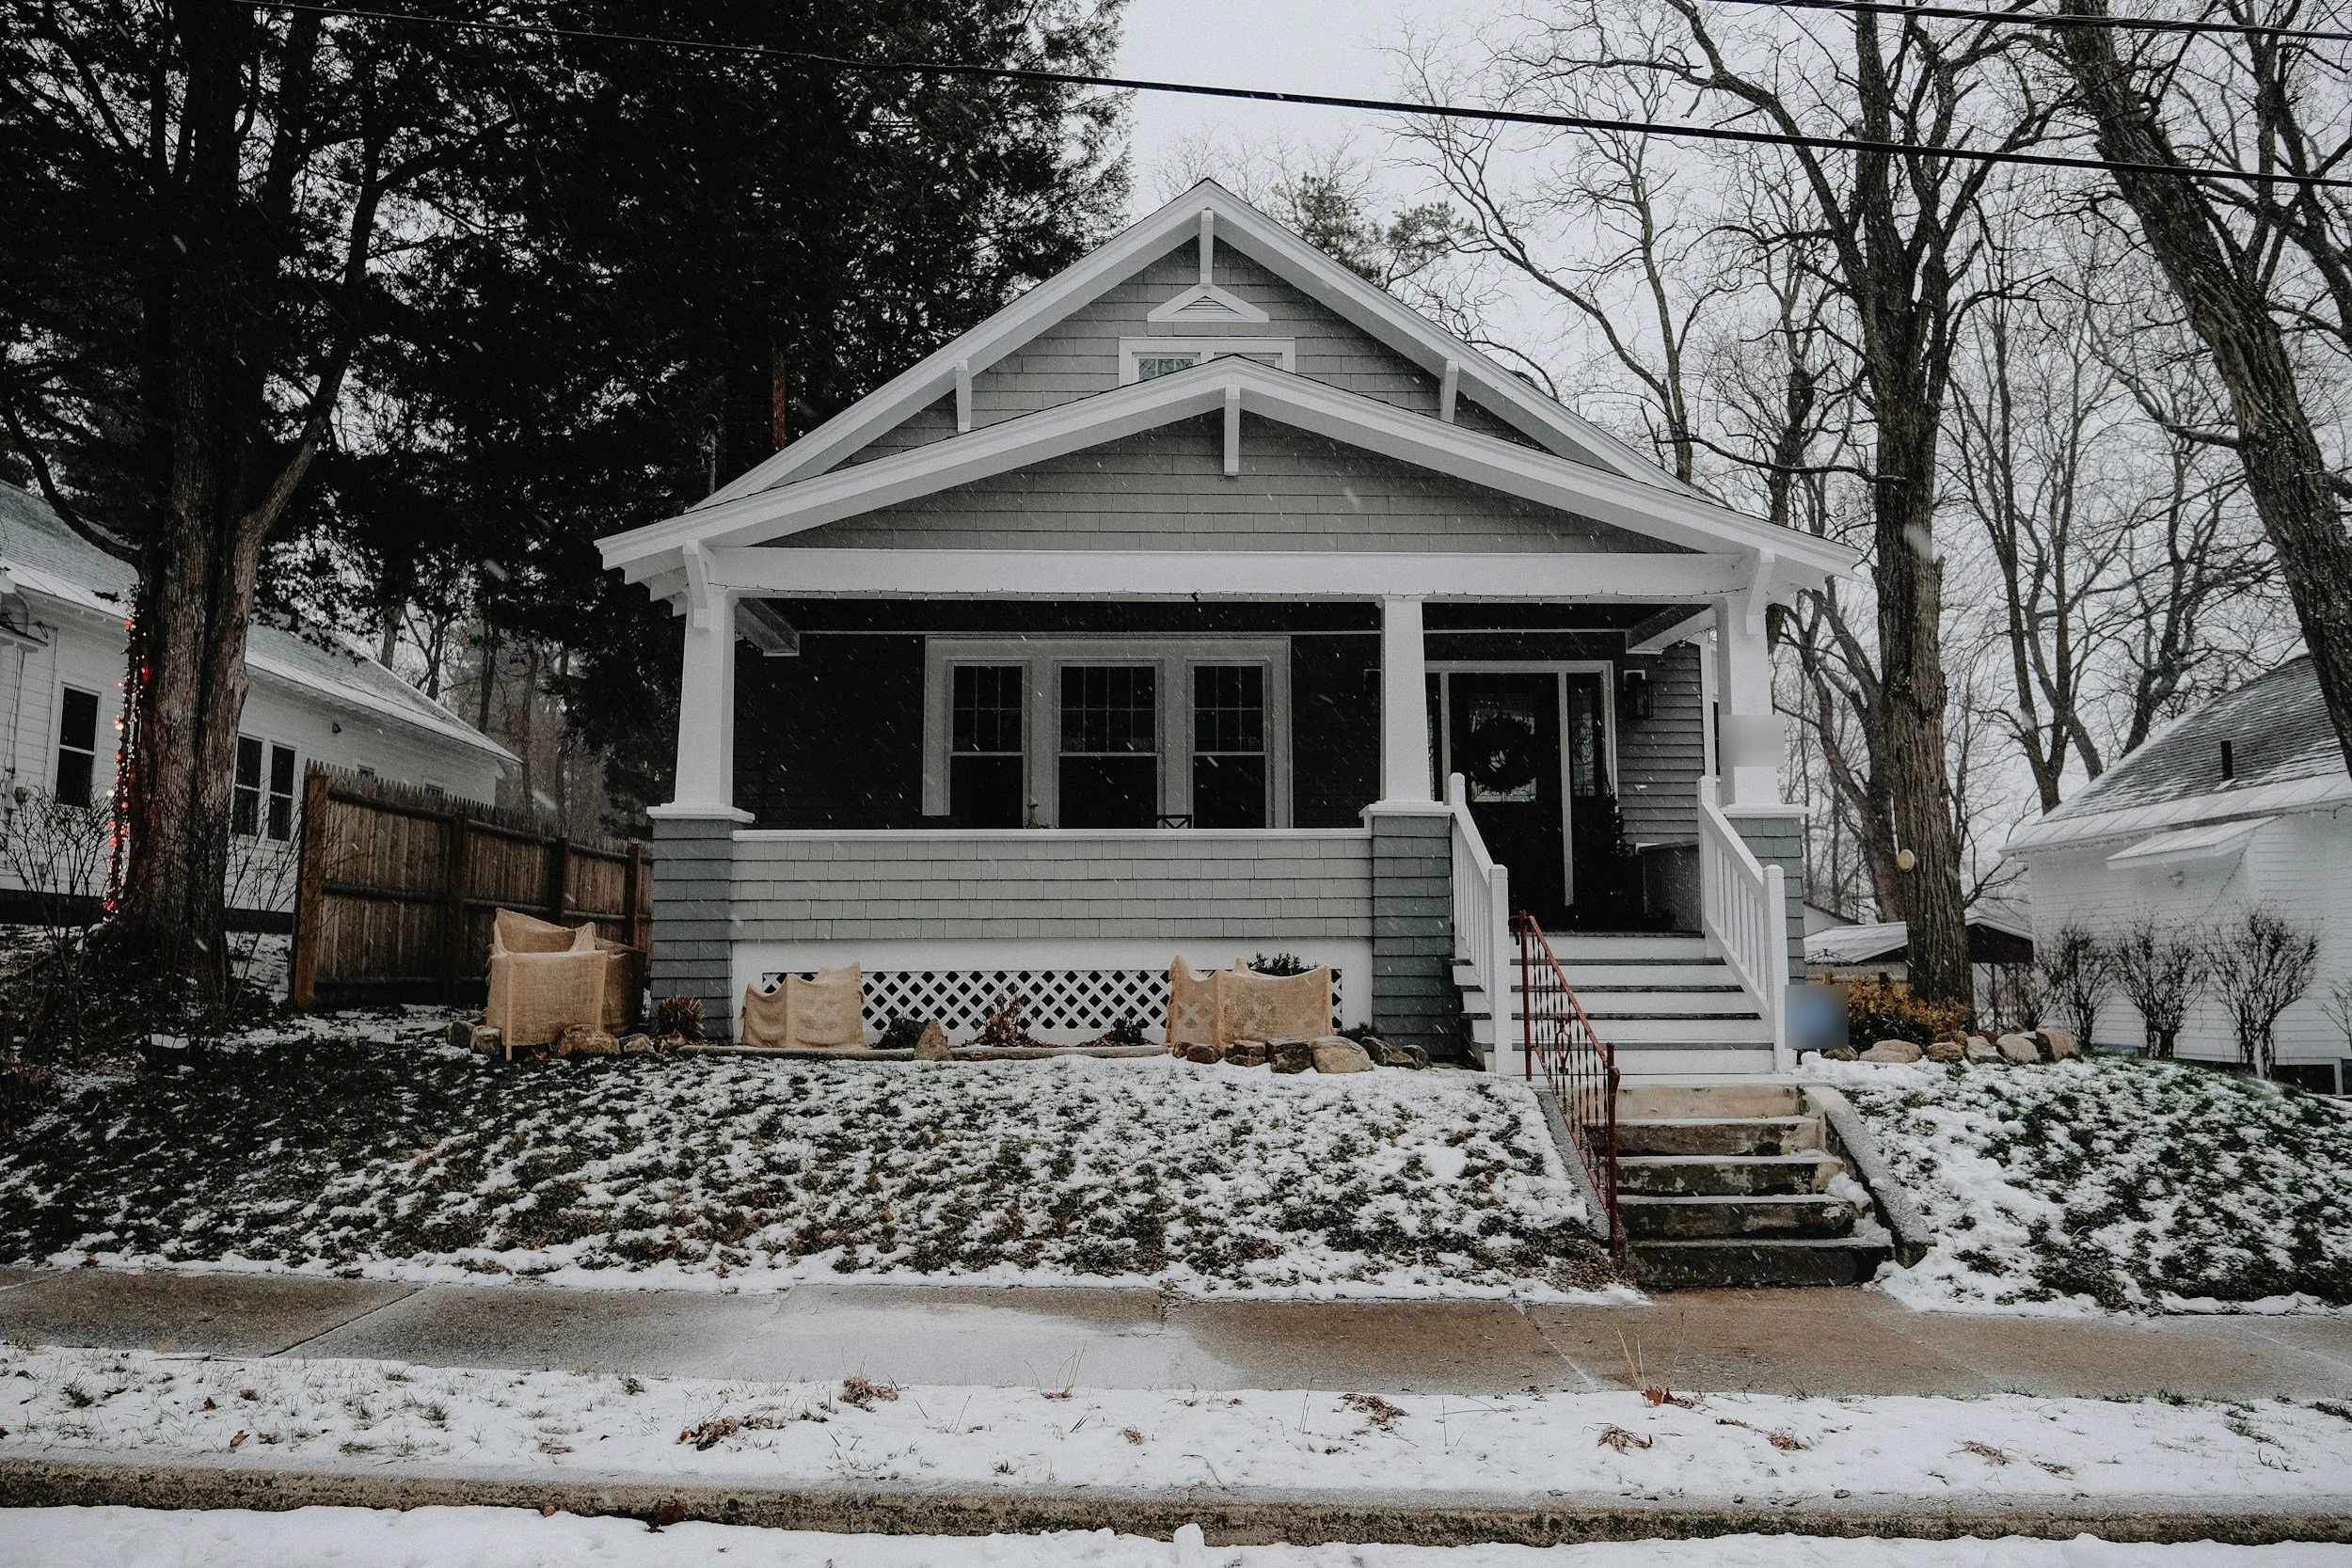
Seattle Housing Market in February 2026: How It Compared to a Normal February
February is when Seattle real estate turns: homes sell at 104.1% of list on average, 9 days faster than January. Here is February 2026 against a normal February, and where the market stands now.
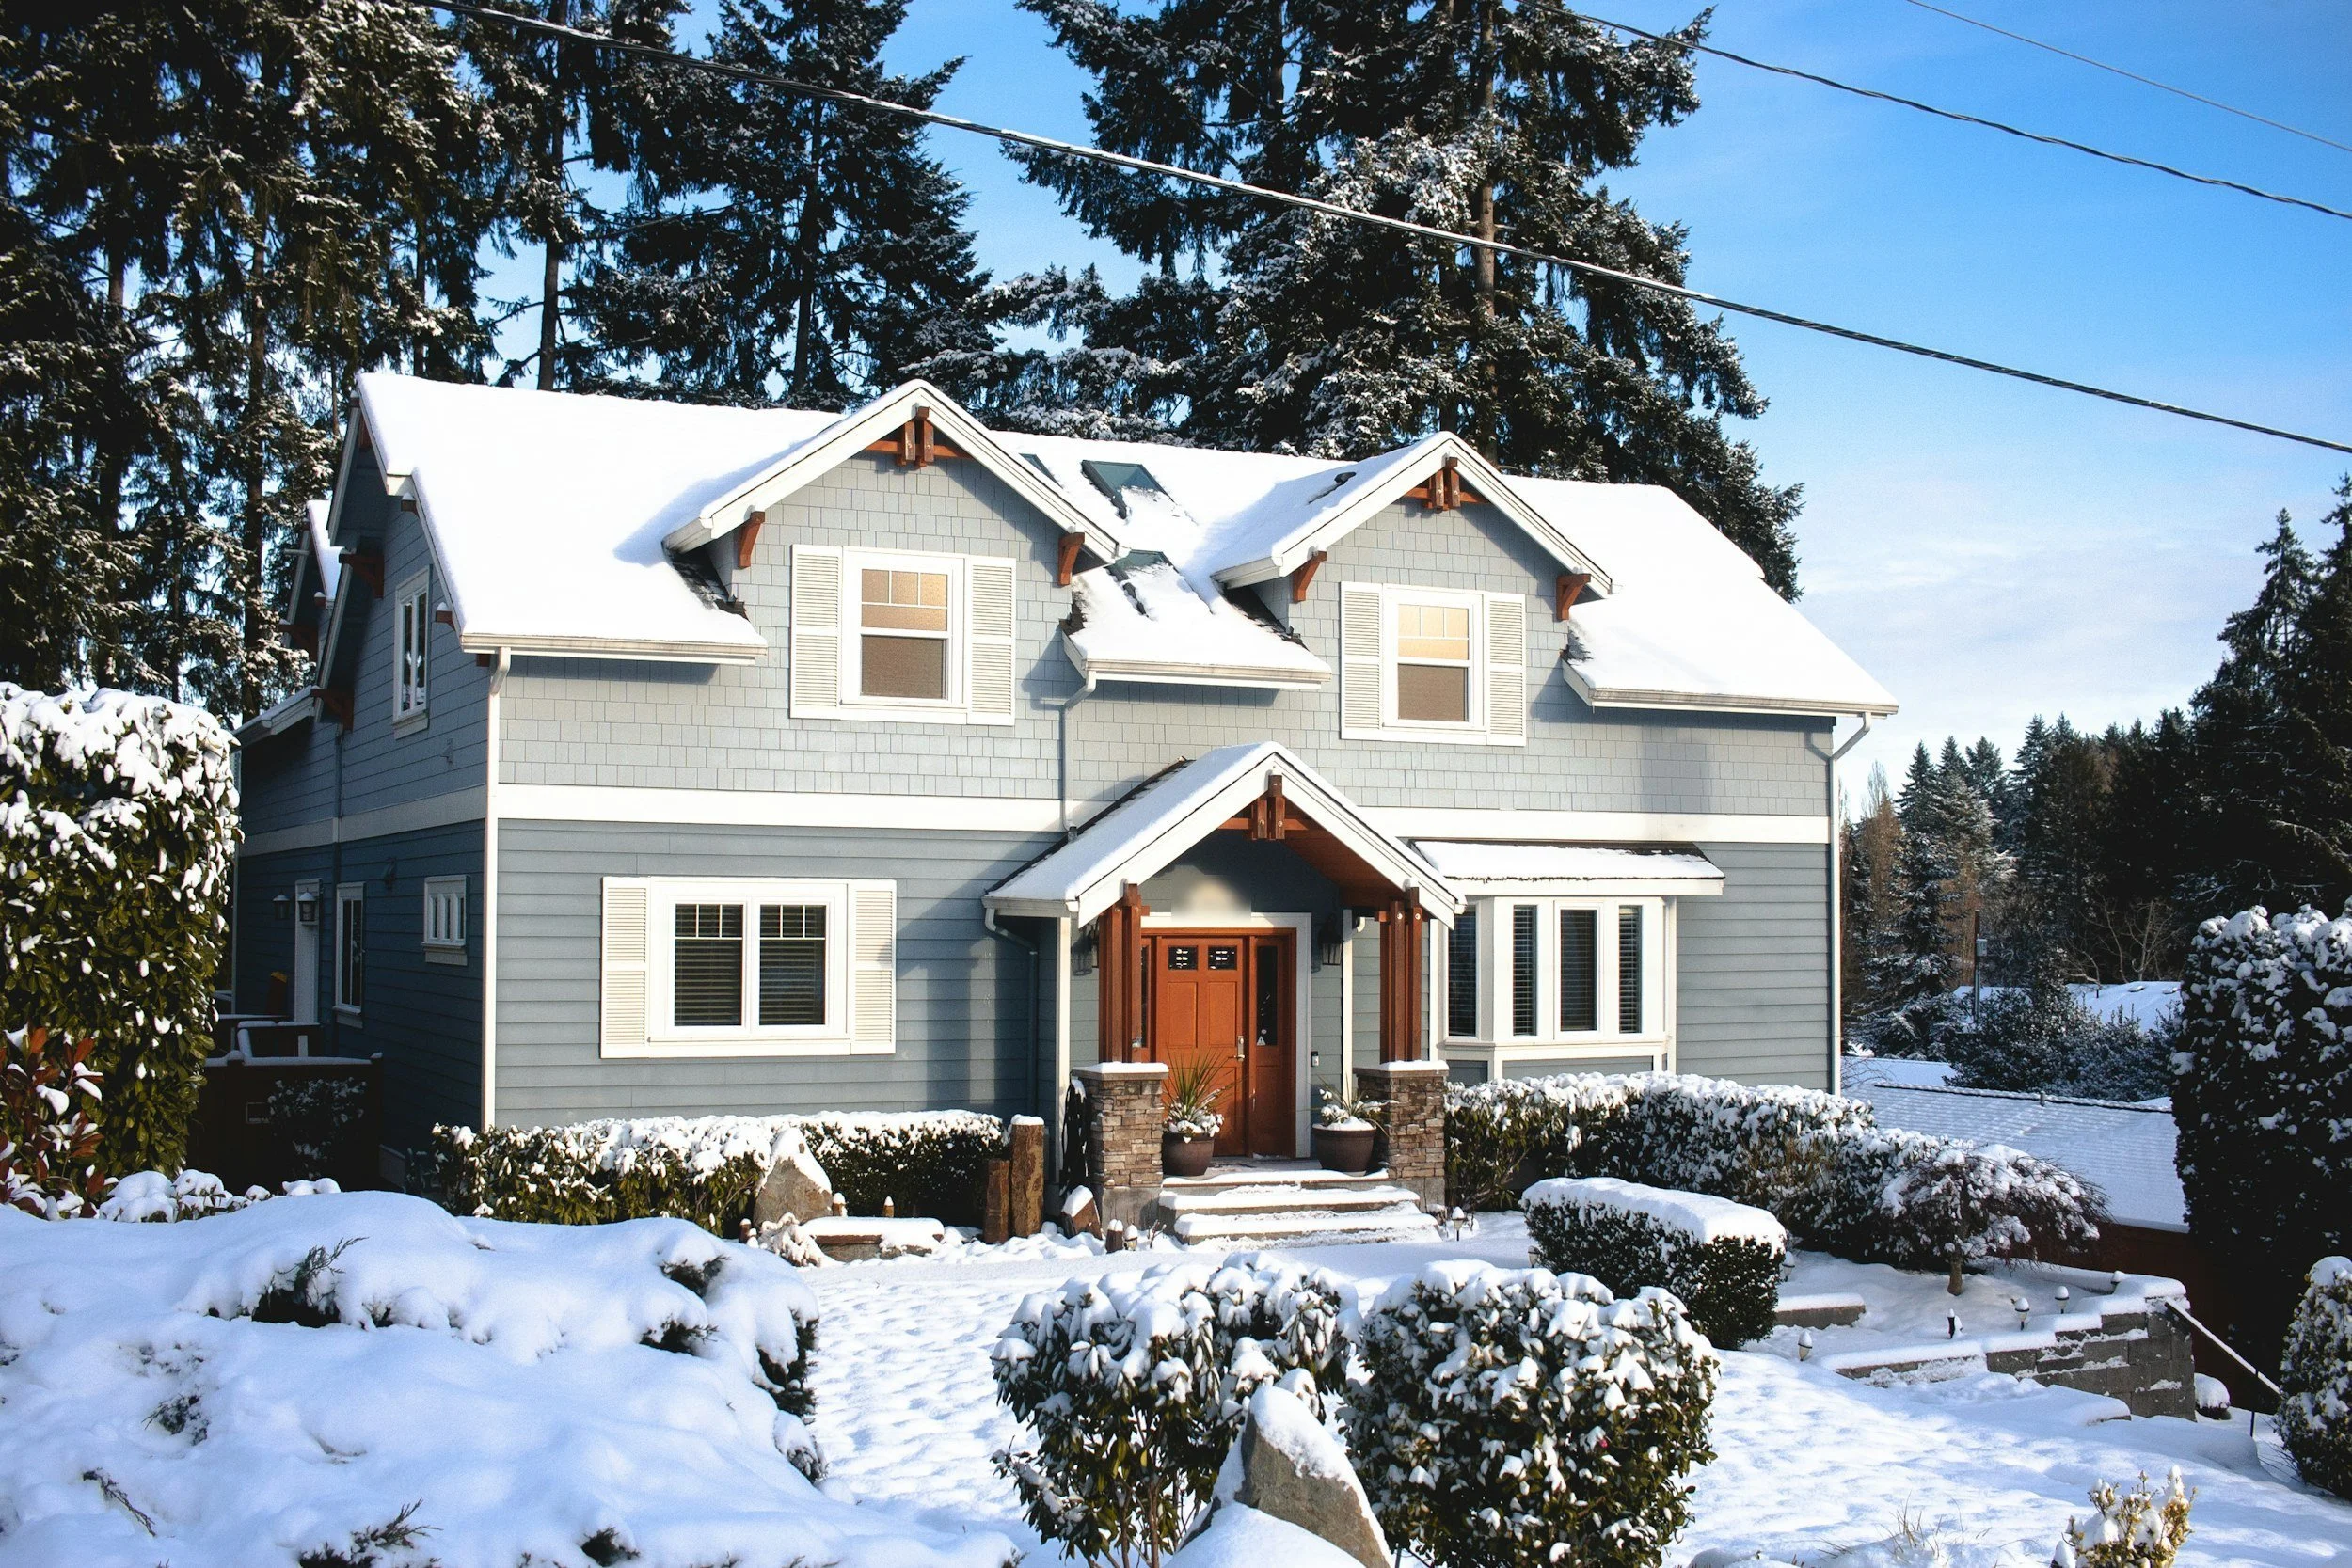
Seattle Housing Market in January 2026: How It Compared to a Normal January
January restarts Seattle real estate: new listings double December’s and buyers return late in the month, yet homes take the longest to sell. Here is January 2026 against a normal January, and where the market stands now.

Seattle Housing Market in December 2025: How It Compared to a Normal December
December is the quietest month in Seattle real estate: the fewest new listings, prices closest to list and long market times. Here is how December 2025 compared with a normal December, and where the market stands now.

Seattle and Eastside Housing Market by Month: 10-Year Trends
April is the best month to sell a Seattle house, March on the Eastside, and January is the slowest. 10 years of NWMLS data for houses, townhomes and condos, updated monthly.