
Historical Housing Market Trends
by Brian Huie, March 13, 2025
Why Market News is Always Behind - And What That Means to You
Most market updates you see—from news, social media, and even some realtors—are already outdated. Here’s why even the most well-intentioned experts can miss the mark:
Closed sales reflect deals made 30+ days earlier.
Market stats take 1-2 weeks to compile and publish.
News outlets and blogs report on those stats weeks later.
Social media influencers and slow reporters keep recycling the info for months.
An October listing could accept an offer in November, close in December, be reported in January stats, and still be reported on social in February/March.
The good news? We [NWMLS Realtors] now track LIVE data on pending home sales before a home closes - so you don’t have to rely on stale reports. Looking for long-term trends? Keep reading for a decade of market history.
Historical Trends
New Listings vs Active Inventory vs Monthly Supply
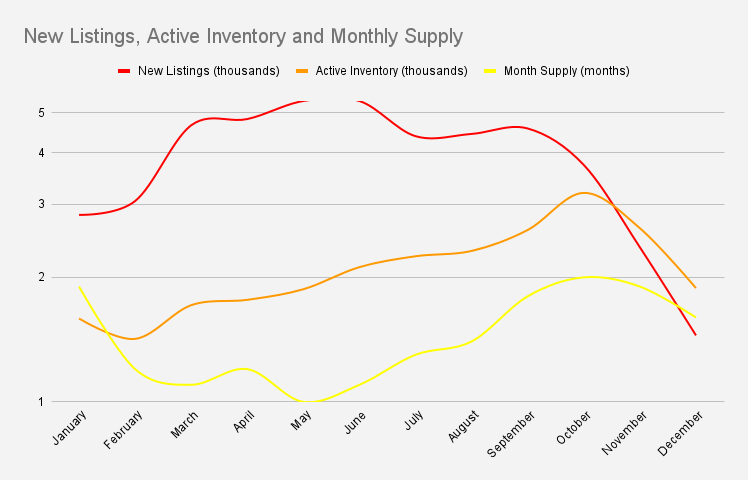
Data compiled from compiled from 2015-2019 and 2021-2024 between 520 and i90
New Listings most frequent March-September
Most homes to choose from in October
“Month Supply” is the time it takes for the current active listings to deplete at the current sales pace. Very low in spring and summer despite having the most new listings, indicating higher buyer activity
Sales Price to Original Listing Price to Time on Market

Data compiled from compiled from 2015-2019 and 2021-2024 between 520 and i90
Sale Price/Original Listing Price is highest in May and lowest in January but is a 2-6 week lagging indicator based on a successful sale and doesn’t include the original prices of prior unsuccessful listings (a home may have taken several listings over many months to sell).
Average time on market lowest in May, highest in December and doesn’t include the time a listing has spent on market in a prior unsuccessful listing (a home may have taken several listings over many months to sell).
Home LoansAverage Fixed 30 Year Mortgage Rates
New loan applications peak mid to late January each year.
Yellow markers indicate the highest point of applications in each year (January); Blue marker is the last reported data for that year (End of December)
National average time a buyer closes after their most recent preapproval is 50-days with a 45 day transaction. It is common in Seattle Greater to search for 3-9 months and transact in 15-28 days.


Brian’s Client Q&A on rates:
Q: If fed rates don’t affect mortgage rates, what does?
A: 10Y Treasury bond, Inflation/CPI/Jobs Reports, World Events.