
Greater Seattle Housing Market News
(updated 9/16/2025)
news and blog for homebuyers, sellers, and homeowners
Explore neighborhoods, home maintenance, design, and market trends


Housing inventory, mortgage rates, and market trends

Housing Inventory
6,757* King County home listings - Expect sustained large number of new listings through Summer with buyer activity/absorption rates fluctuating in regular seasonal patterns. Inventory typically peaks in August/ September with new listings peaking in July/August.
*Avg between 3-7K

Mortgage Rates
6.25%* (avg 30yr fixed**), up m/m, up w/w, volatile, but in the expected 6.5-7 range expected of 2026
https://www.mortgagenewsdaily.com/mortgage-rates/30-year-fixed
*based on survey of 200 lenders top tier current loans (usually 15% down, 680+ credit)**“Average 30yr fixed“ is standard for reporting - The 50 year average of the “average 30-year fixed” is ~7.75%.

Week over Week
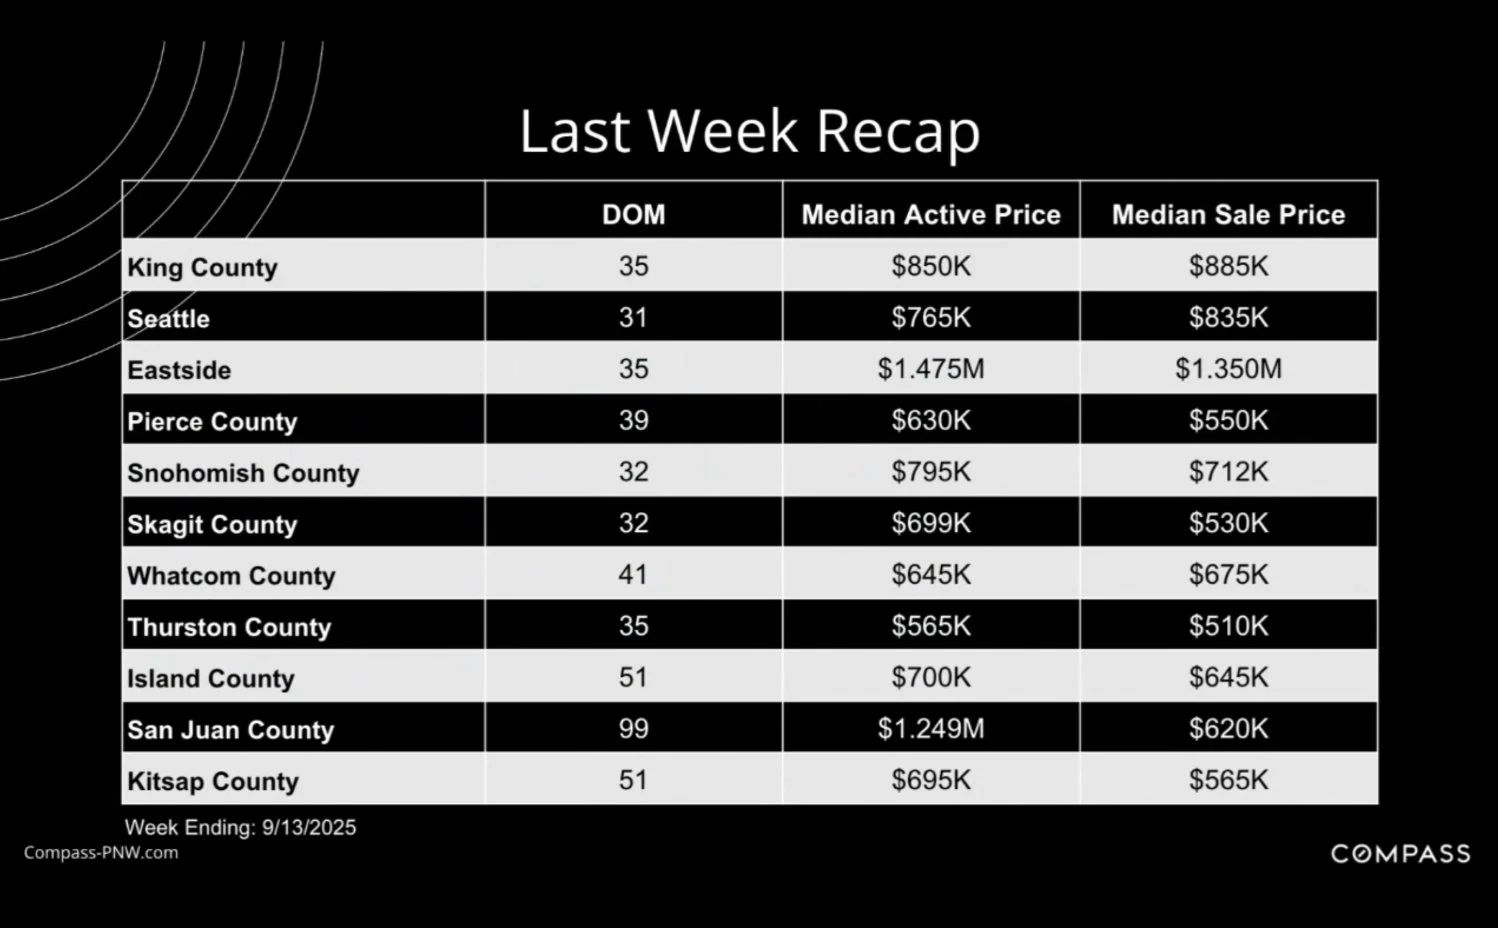
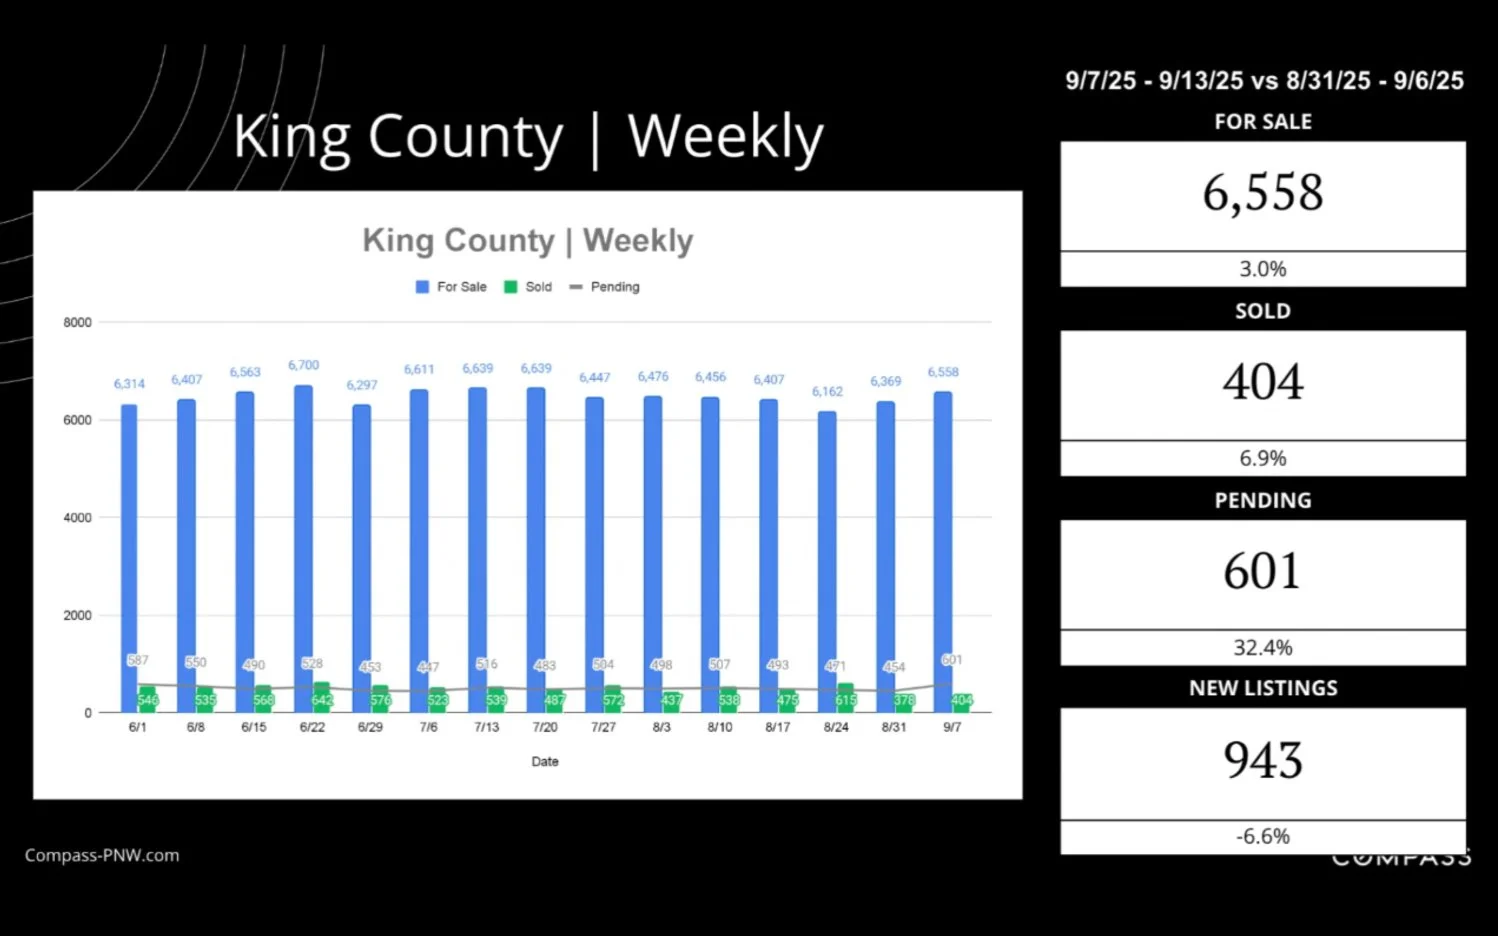
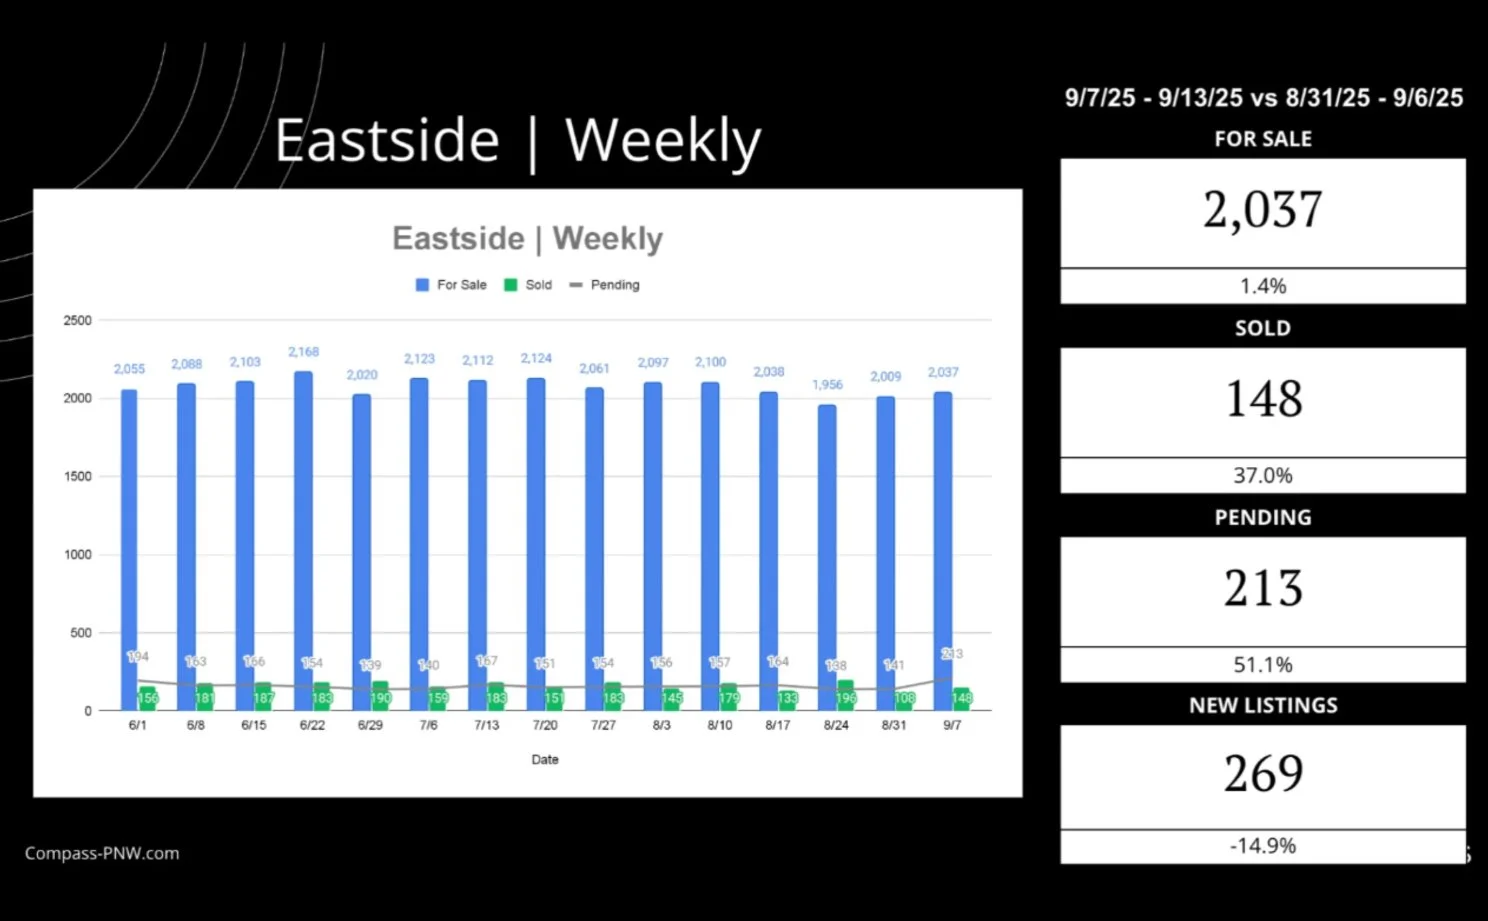
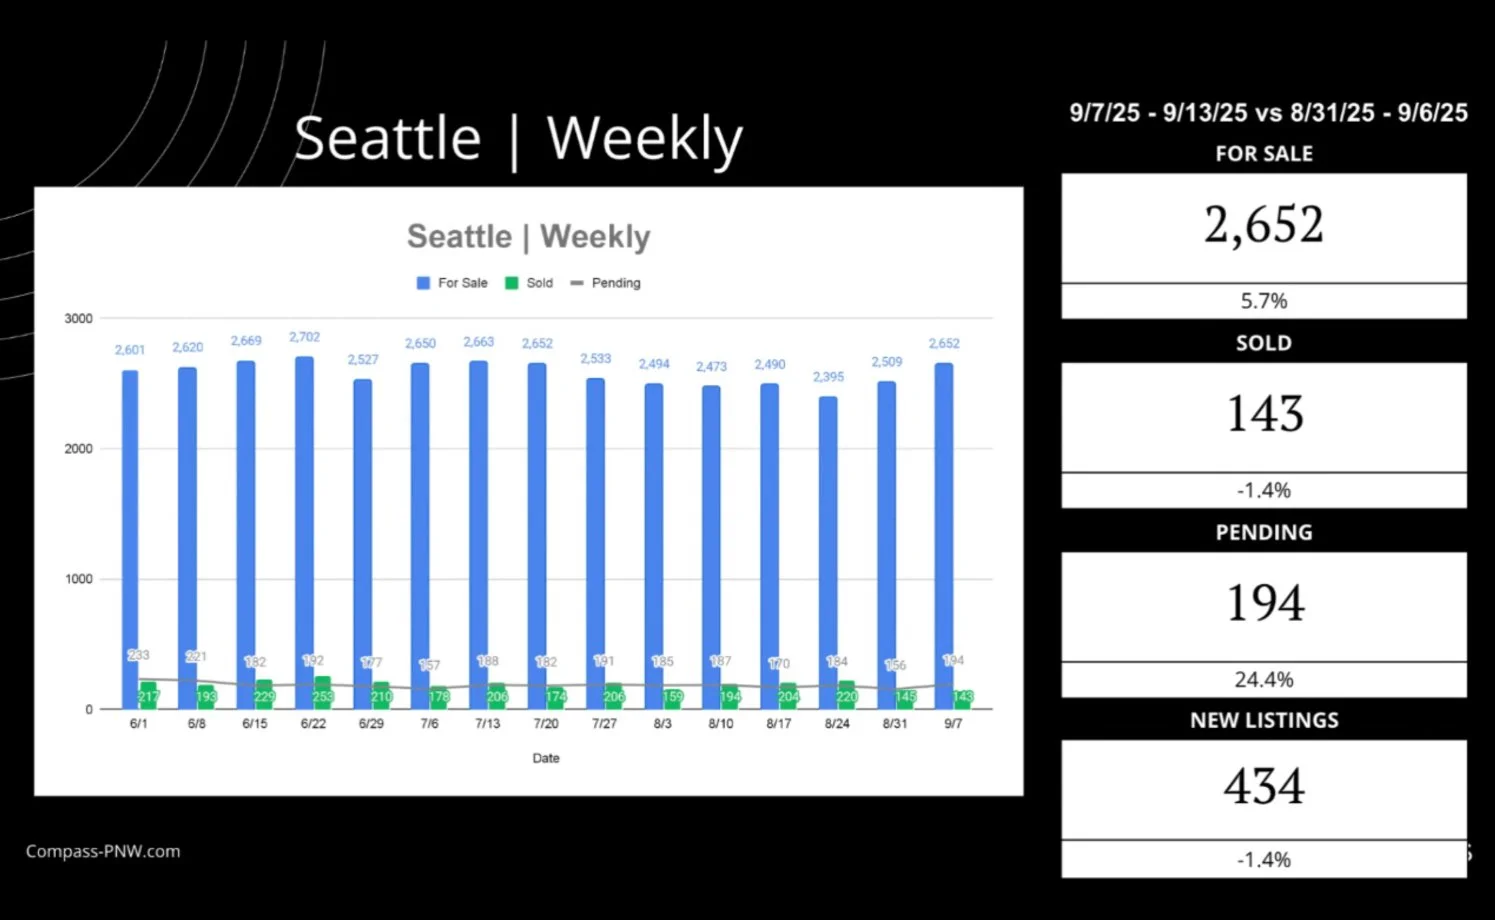
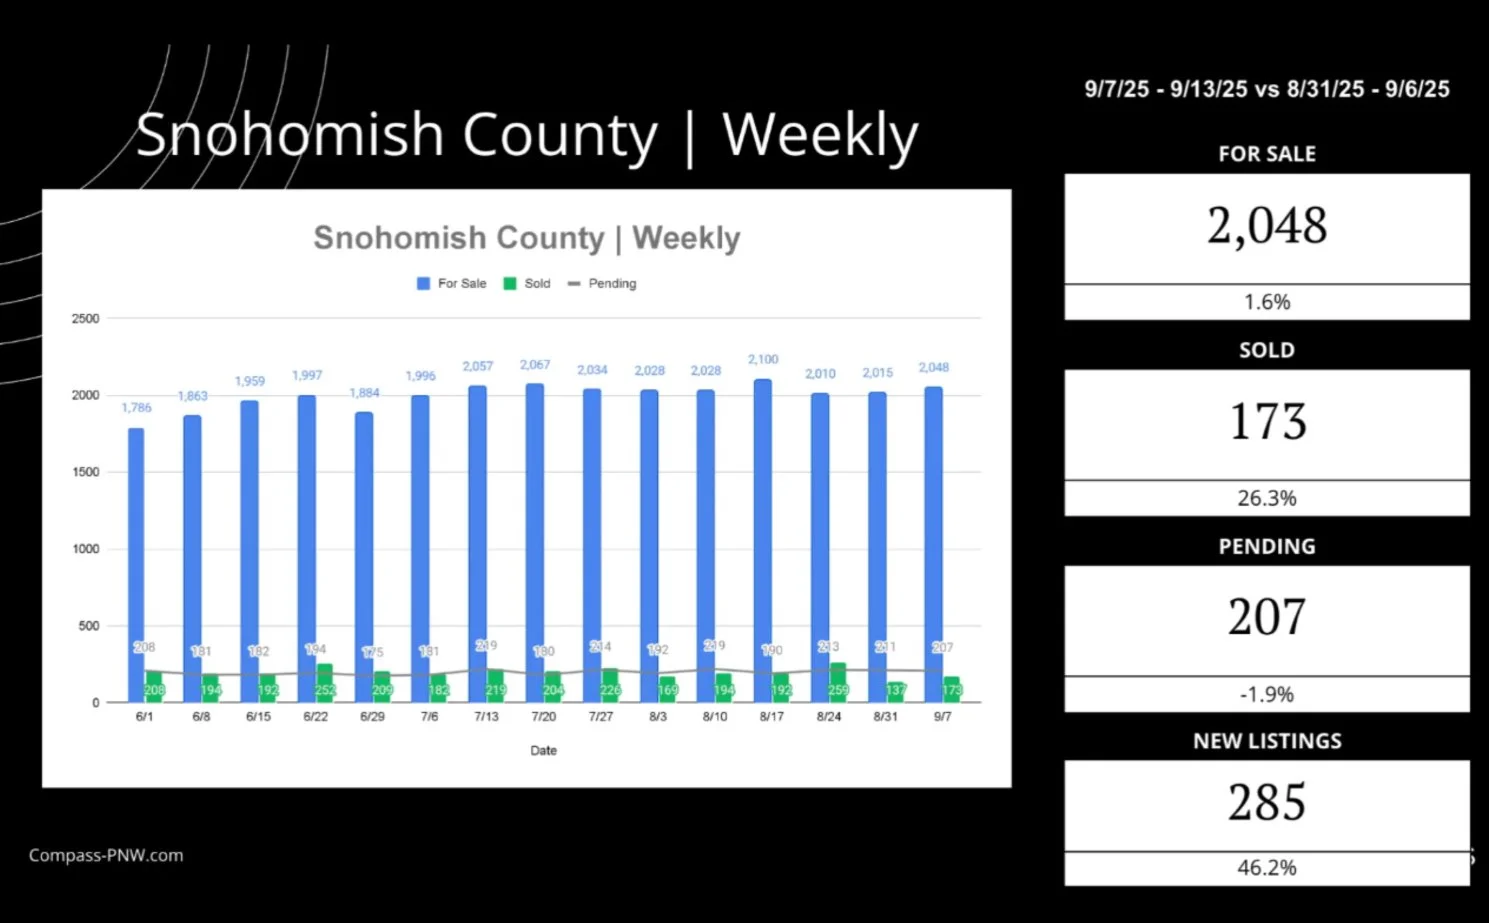
The holiday week amplified seasonal slowing as new listings spiked while closings fell sharply across the region. King, Seattle, and Eastside each saw inventory rise on a flood of new listings, with pendings soft and solds nearly halved. Pierce and Snohomish showed the same trend—more listings, fewer sales, and flat pendings—while Skagit stood out with a strong jump in pendings despite weaker closings. Other counties, including Whatcom, Thurston, Island, San Juan, and Kitsap, all softened with fewer transactions and lighter new listing flow. Even with reduced activity, days on market, median active price, and median sale price held steady, pointing to resilient pricing as buyers paused during the holiday week.

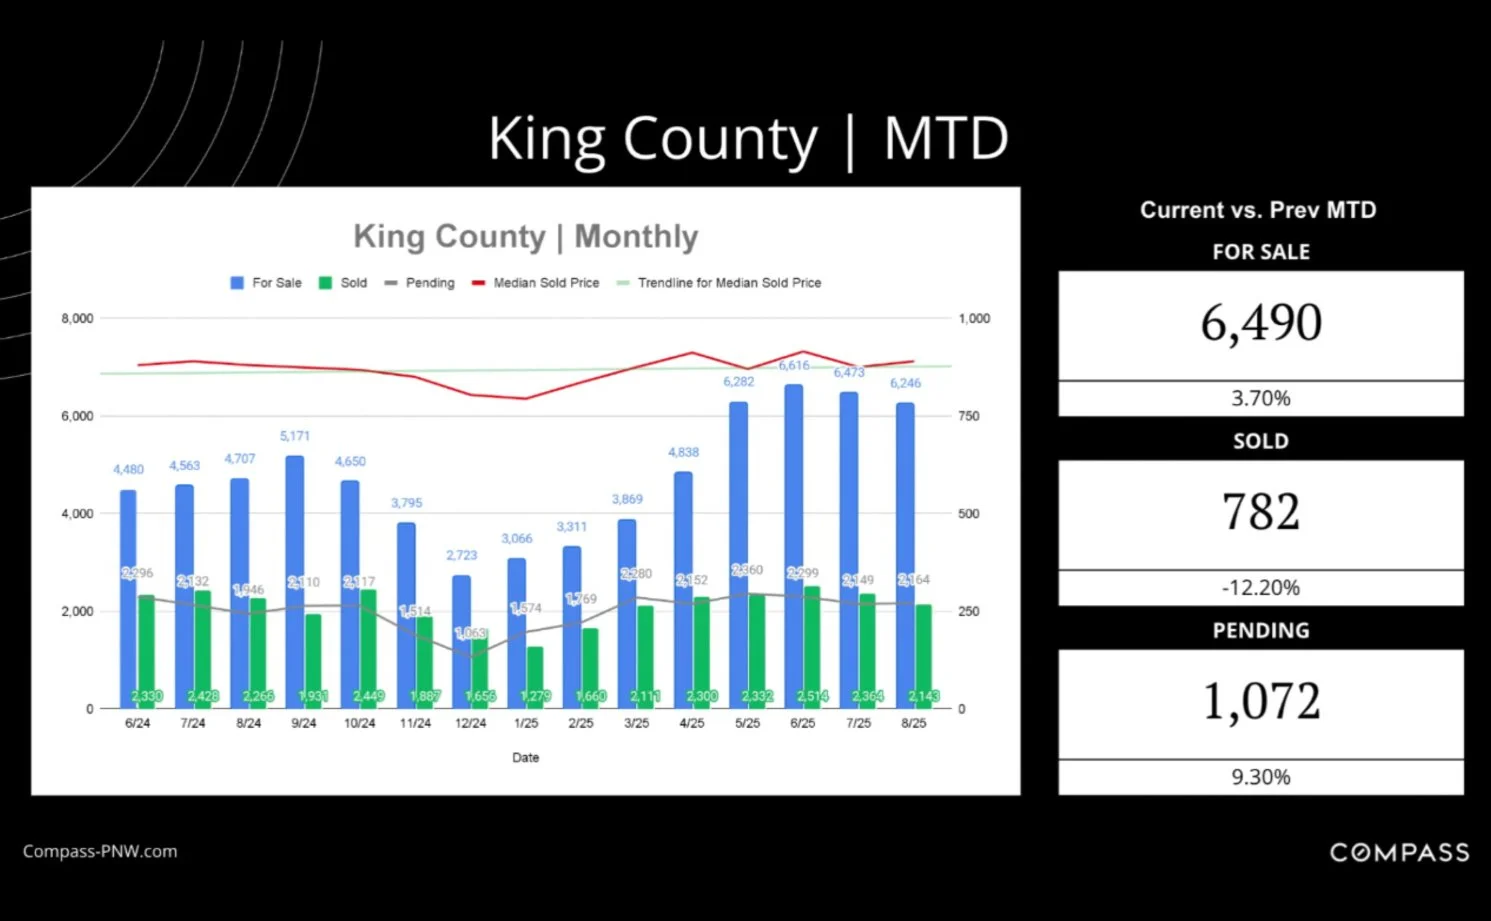
Month over Month
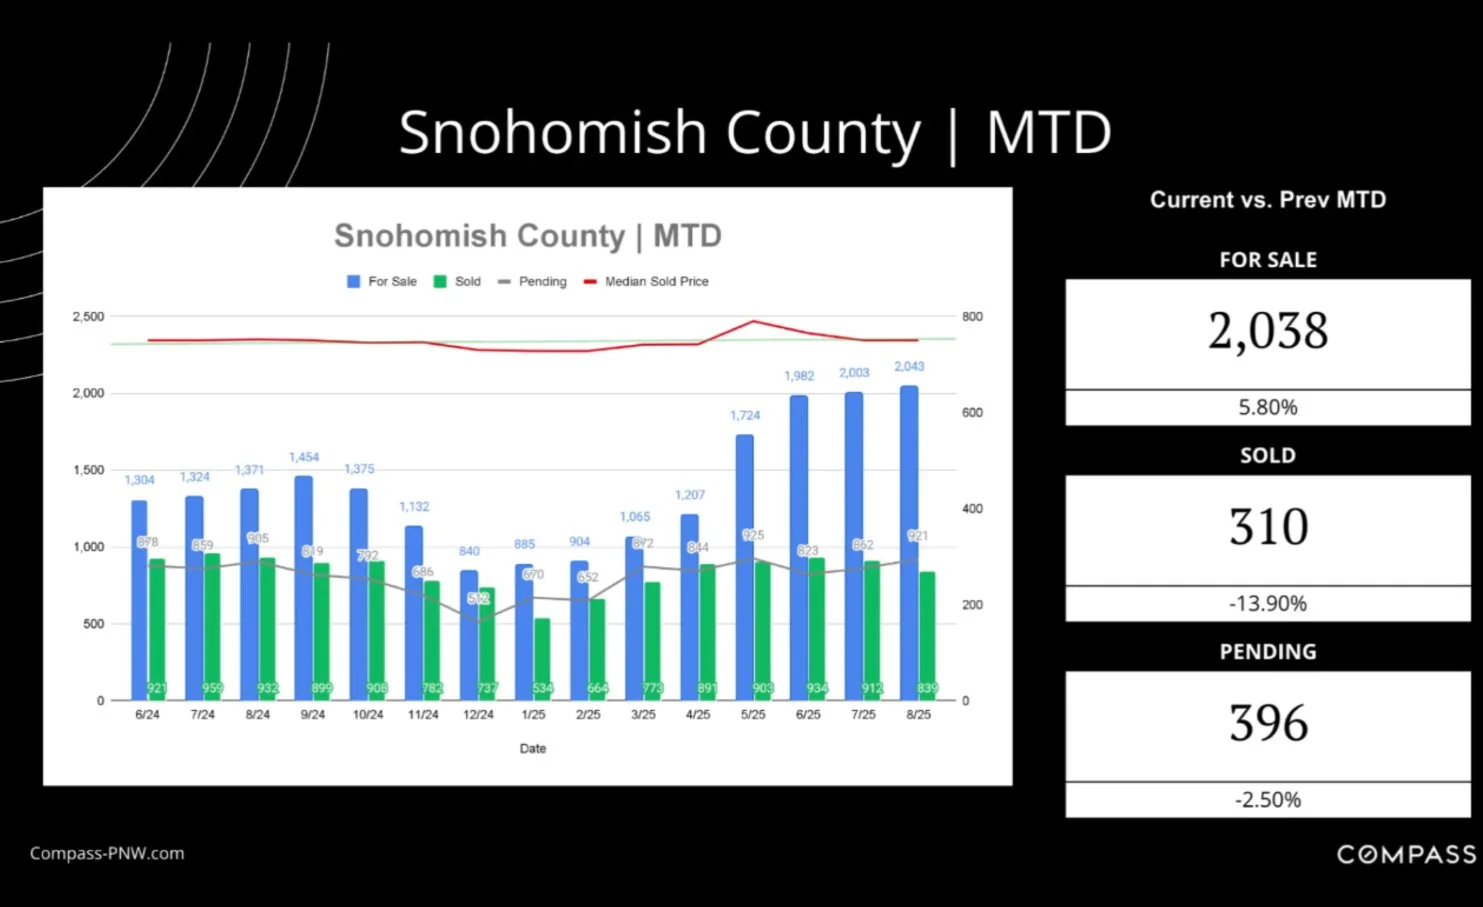
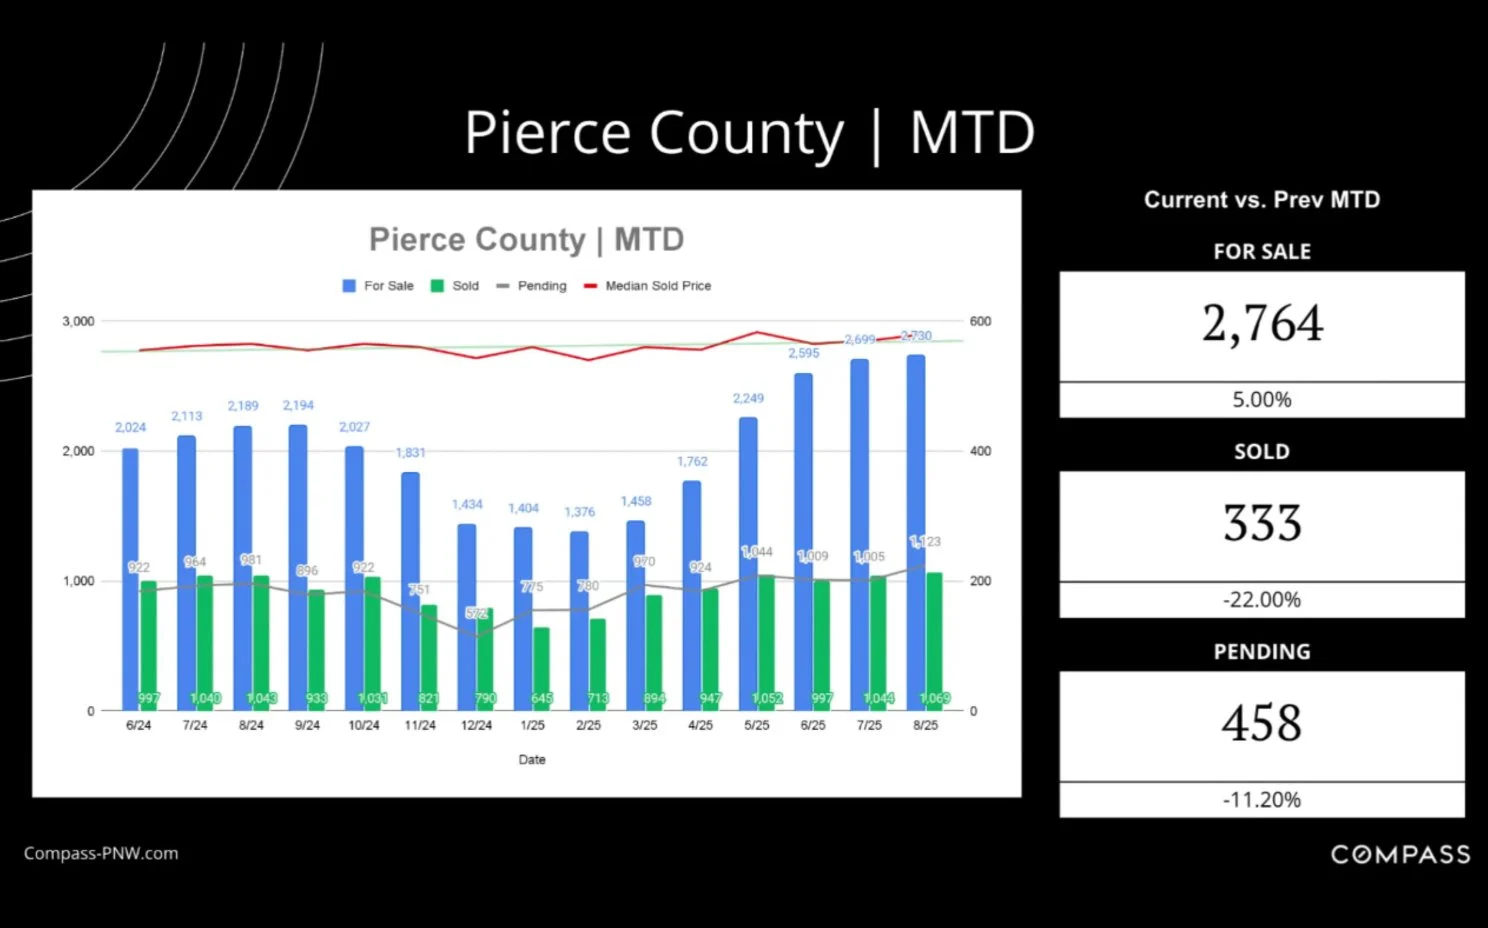
Early September brought a noticeable cool-down across most Puget Sound counties. King and Pierce saw rising inventory but sharp declines in pendings and solds, while Snohomish and Skagit showed more balanced demand with pendings trending up despite softer closings. Whatcom County was the strongest, with both pendings and solds rising even as inventory slipped. In contrast, Thurston, Island, San Juan, and Kitsap experienced slower sales and contracting demand. Overall, the market is shifting toward longer timelines and softer activity, with a few counties holding firmer than others.
Current Stats
August Stats
Avg Showings to Pending: 11
Avg Showings Per Listing: 3.9
Avg Condo Showings to Pending: 6
Avg Condo Showings Per Listing: 2.8
Headline News
Home prices expected to continue to rise even with stubborn high interest rates in 2025/2026
4% increase in home values through 2025. Expected inflation from imminent tariffs to keep 30yr average rates 6-7%. https://www.businessinsider.com/buying-a-home-mortgage-rates-price-affordability-housing-market-outlook-2024-12
2024 Slowest Year In Real Estate sales since 1995
FNMA expects 2024 sales to end at 4.7M with a slow but slightly better 5.1M in 2025 if mortgage rates improve 2025 Q3/4. https://www.fanniemae.com/research-and-insights/forecast/economic-developments-september-2024
https://www.cnn.com/2025/01/24/economy/us-home-sales-worst-year-in-three-decades/
“Priced to Sell” is worth 8.5%
Homes marketing their value as a good deal are discounting their home to an average of 8.5%. Seattle metro average is 3.7% and by 2.8% of September’s listings. https://www.realtor.com/research/september-2024-priced-to-sell/
Historical Trends
Click bait headlines report these trends as if they are unprecedented - These graphs show trends similar to patterns we have seen happen nationwide and through several decades.

Data from 2017-2019/2021-2023 in Seattle, Mercer Island, Kirkland, Bellevue, Medina, Clyde Hill from WA-520 to I90
New Listings most frequent March-October
Most homes to choose from in October
Month Supply is the time it takes for the current active listings to deplete at the current sales pace. Very low in spring and summer despite having the most new listings, indicating higher buyer activity

Sale Price/Original Listing Price is highest in May and lowest in January but is a 2-6 week lagging indicator based on a successful sale and doesn’t include the original prices of prior unsuccessful listings (a home may have taken several listings over many months to sell).
Average time on market lowest in May, highest in December and doesn’t include the time a listing has spent on market in a prior unsuccessful listing (a home may have taken several listings over many months to sell).
Data from 2017-2019/2021-2023 in Seattle, Mercer Island, Kirkand, Bellevue, Medina, Clyde Hill from WA-520 to I90

New loan applications peak mid to late January each year.
Yellow markers indicate the highest point of applications in each year (January); Blue marker is the last reported data for that year (End of December)
National average time a buyer closes after their most recent preapproval is 50-days with a 45 day transaction. It is common in Seattle Greater to search for 3-9 months and transact in 15-28 days.

Brian’s Client Q&A:
Question: If fed rates don’t affect mortgage rates, what does?
Answer: 10Y Treasury bond, Inflation/CPI/Jobs Reports, World Events.
https://home.treasury.gov/policy-issues/financing-the-government/interest-rate-statistics
https://www.epi.org/indicators/unemployment/
https://www.bls.gov/cpi/
News in Three
Brian’s Forecast
Q4’24 Avg 7% (fluctuating 6.75-7.25); Q1’25 6.75% (fluctuating 6.5-7); Q4’25 6.25% (fluctuating 6-6.5).
Reminder: mortgage rates are not affected by fed decisions but 10-yr bond - 10 yr bond rates affected by inflation and investor’s willingness to invest in bonds vs stocks.
Brian’s Client Tip: 1% decrease in interest CAN roughly equal to 10% more borrowing power but even a 0.5% fluctuation changes buyer demand (and thus competition) the week or two after the fluctuation hits headlines.
https://money.usnews.com/loans/mortgages/mortgage-rate-forecastBrian’s Client Q&A: If fed rates don’t affect mortgage rates, what does? 10Y Treasury bond, CPI/Jobs Reports
https://home.treasury.gov/policy-issues/financing-the-government/interest-rate-statistics
https://www.epi.org/indicators/unemployment/
https://www.bls.gov/cpi/
Increase buyer competition in Q1/Q2’25
Widespread use of escalation clauses with promises to pay additional down in case of low appraisals or even waived financing in all of 2025 from the vast number of sidelined buyers, our growing population, Amazon and half dozen major companies returning to full return to office (1/1/25), and those “typical” new buyers each spring/summer.
Improved condo market from increased DT workers. Also increased metro traffic will increase desired urban living or at least pied-à-terres.
Bully offers will increase in the Eastside in Q1 and Seattle + Seattle metro will see frequent bully offers by Q2.
Increased absorption rate and decreased monthly supply due to World class events like 2025 FIFA Club World Cup in June ‘25 will increase buyer activity before Seattle’s hosting of FIFA’s ‘26 World Cup but won’t encourage sellers to sell
Continued low inventory at least into next decade
Minor bump in inventory in 2025 as more sellers will be more comfortable becoming buyers themselves with the lower interest rates and increased consumer confidence.
All economists agree of not enough housing at least through the decade nationwide but especially in Seattle metro where for decades it has been normal to only have 3-4 month inventory opposed to a “balanced” 6 months
Blog


Newsletter
Join the hundreds of informed buyers, sellers, and homeowners
To stay updated with buying, accessorizing, maintaining & updating a home in Seattle